Czech vs Blackfeet Householder Income Ages 25 - 44 years
COMPARE
Czech
Blackfeet
Householder Income Ages 25 - 44 years
Householder Income Ages 25 - 44 years Comparison
Czechs
Blackfeet
$96,525
HOUSEHOLDER INCOME AGES 25 - 44 YEARS
74.8/ 100
METRIC RATING
151st/ 347
METRIC RANK
$81,531
HOUSEHOLDER INCOME AGES 25 - 44 YEARS
0.1/ 100
METRIC RATING
293rd/ 347
METRIC RANK
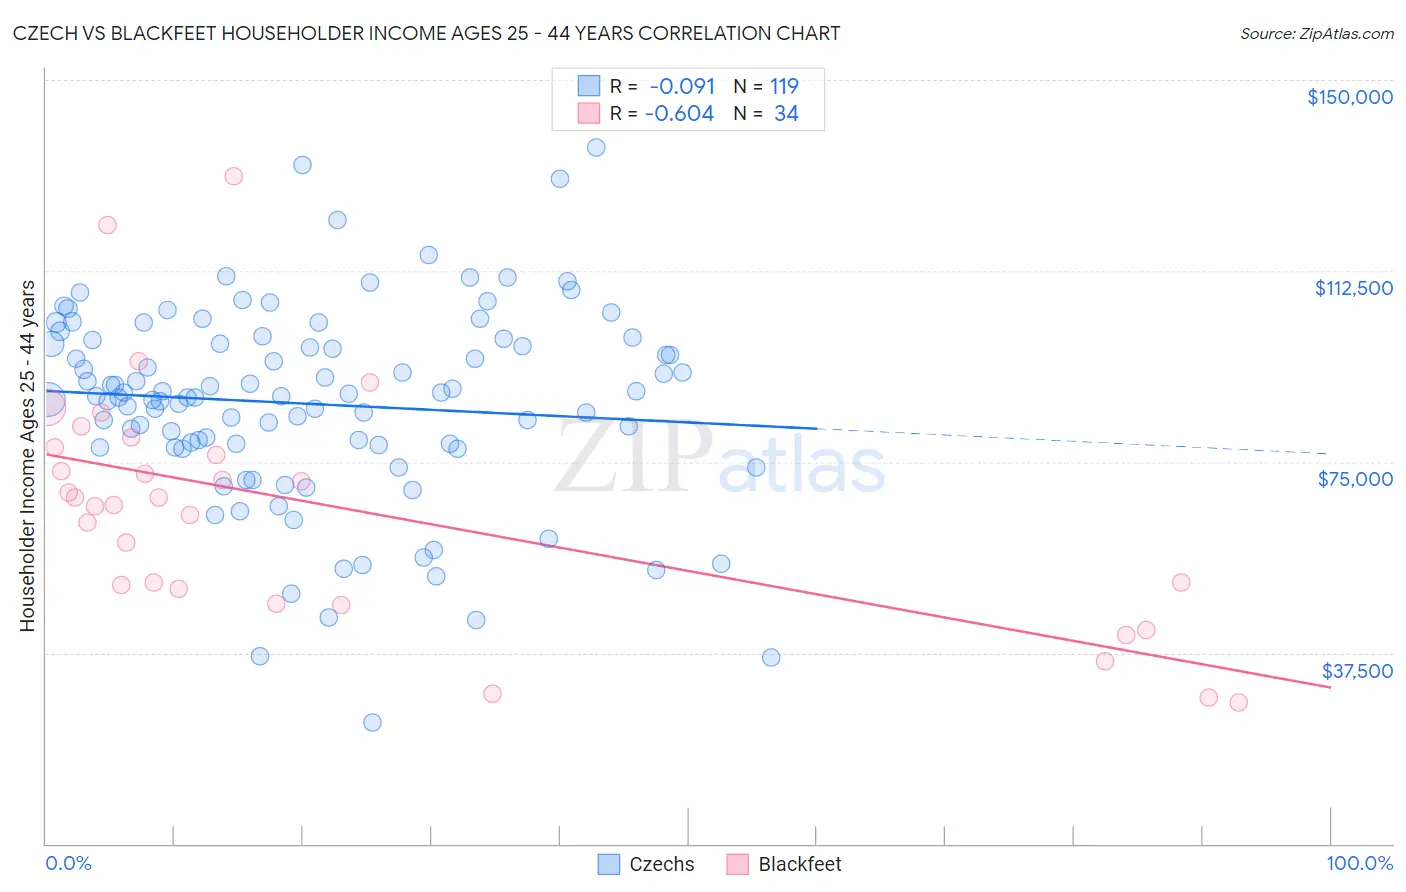
Czech vs Blackfeet Householder Income Ages 25 - 44 years Correlation Chart
The statistical analysis conducted on geographies consisting of 482,514,709 people shows a slight negative correlation between the proportion of Czechs and household income with householder between the ages 25 and 44 in the United States with a correlation coefficient (R) of -0.091 and weighted average of $96,525. Similarly, the statistical analysis conducted on geographies consisting of 308,973,365 people shows a significant negative correlation between the proportion of Blackfeet and household income with householder between the ages 25 and 44 in the United States with a correlation coefficient (R) of -0.604 and weighted average of $81,531, a difference of 18.4%.
Householder Income Ages 25 - 44 years Correlation Summary
| Measurement | Czech | Blackfeet |
| Minimum | $23,929 | $27,639 |
| Maximum | $136,755 | $131,023 |
| Range | $112,826 | $103,384 |
| Mean | $86,343 | $65,857 |
| Median | $87,904 | $67,276 |
| Interquartile 25% (IQ1) | $77,941 | $50,050 |
| Interquartile 75% (IQ3) | $99,022 | $77,787 |
| Interquartile Range (IQR) | $21,080 | $27,737 |
| Standard Deviation (Sample) | $19,593 | $23,588 |
| Standard Deviation (Population) | $19,511 | $23,239 |
Similar Demographics by Householder Income Ages 25 - 44 years
Demographics Similar to Czechs by Householder Income Ages 25 - 44 years
In terms of householder income ages 25 - 44 years, the demographic groups most similar to Czechs are South American Indian ($96,497, a difference of 0.030%), Slovene ($96,439, a difference of 0.090%), Ugandan ($96,667, a difference of 0.15%), Slavic ($96,377, a difference of 0.15%), and Basque ($96,709, a difference of 0.19%).
| Demographics | Rating | Rank | Householder Income Ages 25 - 44 years |
| Immigrants | Chile | 80.8 /100 | #144 | Excellent $97,159 |
| Norwegians | 78.2 /100 | #145 | Good $96,866 |
| Ethiopians | 77.8 /100 | #146 | Good $96,824 |
| Immigrants | Syria | 77.4 /100 | #147 | Good $96,789 |
| Irish | 76.9 /100 | #148 | Good $96,730 |
| Basques | 76.6 /100 | #149 | Good $96,709 |
| Ugandans | 76.2 /100 | #150 | Good $96,667 |
| Czechs | 74.8 /100 | #151 | Good $96,525 |
| South American Indians | 74.5 /100 | #152 | Good $96,497 |
| Slovenes | 73.9 /100 | #153 | Good $96,439 |
| Slavs | 73.2 /100 | #154 | Good $96,377 |
| Moroccans | 70.3 /100 | #155 | Good $96,117 |
| Immigrants | Germany | 67.9 /100 | #156 | Good $95,913 |
| Immigrants | Uganda | 65.2 /100 | #157 | Good $95,698 |
| Scandinavians | 63.9 /100 | #158 | Good $95,596 |
Demographics Similar to Blackfeet by Householder Income Ages 25 - 44 years
In terms of householder income ages 25 - 44 years, the demographic groups most similar to Blackfeet are Cuban ($81,483, a difference of 0.060%), Yaqui ($81,656, a difference of 0.15%), Bangladeshi ($81,363, a difference of 0.21%), Immigrants from Dominica ($81,351, a difference of 0.22%), and Immigrants from Guatemala ($81,341, a difference of 0.23%).
| Demographics | Rating | Rank | Householder Income Ages 25 - 44 years |
| Ute | 0.1 /100 | #286 | Tragic $82,166 |
| Immigrants | Latin America | 0.1 /100 | #287 | Tragic $82,166 |
| Comanche | 0.1 /100 | #288 | Tragic $82,152 |
| Shoshone | 0.1 /100 | #289 | Tragic $82,062 |
| Liberians | 0.1 /100 | #290 | Tragic $82,005 |
| Potawatomi | 0.1 /100 | #291 | Tragic $81,774 |
| Yaqui | 0.1 /100 | #292 | Tragic $81,656 |
| Blackfeet | 0.1 /100 | #293 | Tragic $81,531 |
| Cubans | 0.1 /100 | #294 | Tragic $81,483 |
| Bangladeshis | 0.1 /100 | #295 | Tragic $81,363 |
| Immigrants | Dominica | 0.1 /100 | #296 | Tragic $81,351 |
| Immigrants | Guatemala | 0.1 /100 | #297 | Tragic $81,341 |
| Dominicans | 0.1 /100 | #298 | Tragic $81,229 |
| Immigrants | Liberia | 0.1 /100 | #299 | Tragic $80,863 |
| Cherokee | 0.0 /100 | #300 | Tragic $80,843 |