Chippewa vs Nicaraguan Householder Income Over 65 years
COMPARE
Chippewa
Nicaraguan
Householder Income Over 65 years
Householder Income Over 65 years Comparison
Chippewa
Nicaraguans
$53,847
HOUSEHOLDER INCOME OVER 65 YEARS
0.1/ 100
METRIC RATING
286th/ 347
METRIC RANK
$54,474
HOUSEHOLDER INCOME OVER 65 YEARS
0.1/ 100
METRIC RATING
269th/ 347
METRIC RANK
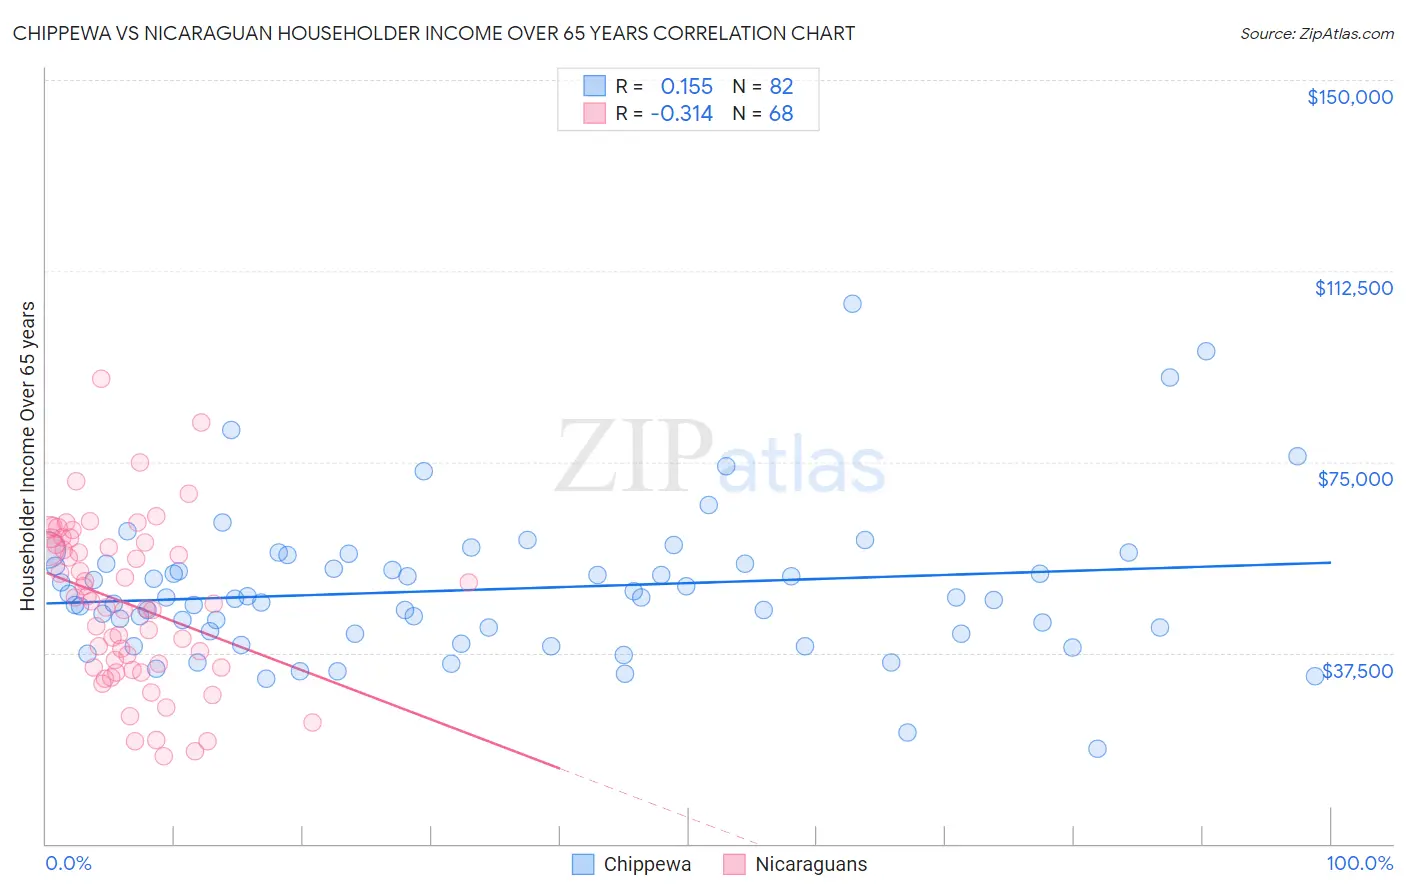
Chippewa vs Nicaraguan Householder Income Over 65 years Correlation Chart
The statistical analysis conducted on geographies consisting of 214,439,477 people shows a poor positive correlation between the proportion of Chippewa and household income with householder over the age of 65 in the United States with a correlation coefficient (R) of 0.155 and weighted average of $53,847. Similarly, the statistical analysis conducted on geographies consisting of 284,992,012 people shows a mild negative correlation between the proportion of Nicaraguans and household income with householder over the age of 65 in the United States with a correlation coefficient (R) of -0.314 and weighted average of $54,474, a difference of 1.2%.
Householder Income Over 65 years Correlation Summary
| Measurement | Chippewa | Nicaraguan |
| Minimum | $18,750 | $17,217 |
| Maximum | $105,938 | $91,300 |
| Range | $87,188 | $74,083 |
| Mean | $49,957 | $47,136 |
| Median | $48,230 | $47,473 |
| Interquartile 25% (IQ1) | $41,250 | $34,685 |
| Interquartile 75% (IQ3) | $55,000 | $59,068 |
| Interquartile Range (IQR) | $13,750 | $24,383 |
| Standard Deviation (Sample) | $14,463 | $15,884 |
| Standard Deviation (Population) | $14,375 | $15,767 |
Demographics Similar to Chippewa and Nicaraguans by Householder Income Over 65 years
In terms of householder income over 65 years, the demographic groups most similar to Chippewa are Mexican ($53,897, a difference of 0.090%), Immigrants from Barbados ($53,766, a difference of 0.15%), Immigrants from Guatemala ($53,950, a difference of 0.19%), Immigrants from Liberia ($53,967, a difference of 0.22%), and Immigrants from Armenia ($53,974, a difference of 0.23%). Similarly, the demographic groups most similar to Nicaraguans are Immigrants from Senegal ($54,447, a difference of 0.050%), Immigrants from Zaire ($54,512, a difference of 0.070%), Guatemalan ($54,526, a difference of 0.10%), Liberian ($54,356, a difference of 0.22%), and Potawatomi ($54,212, a difference of 0.48%).
| Demographics | Rating | Rank | Householder Income Over 65 years |
| Guatemalans | 0.1 /100 | #267 | Tragic $54,526 |
| Immigrants | Zaire | 0.1 /100 | #268 | Tragic $54,512 |
| Nicaraguans | 0.1 /100 | #269 | Tragic $54,474 |
| Immigrants | Senegal | 0.1 /100 | #270 | Tragic $54,447 |
| Liberians | 0.1 /100 | #271 | Tragic $54,356 |
| Potawatomi | 0.1 /100 | #272 | Tragic $54,212 |
| Indonesians | 0.1 /100 | #273 | Tragic $54,176 |
| Barbadians | 0.1 /100 | #274 | Tragic $54,163 |
| Cherokee | 0.1 /100 | #275 | Tragic $54,133 |
| Cree | 0.1 /100 | #276 | Tragic $54,129 |
| Cheyenne | 0.1 /100 | #277 | Tragic $54,096 |
| Immigrants | Ecuador | 0.1 /100 | #278 | Tragic $54,030 |
| Blackfeet | 0.1 /100 | #279 | Tragic $54,029 |
| Immigrants | Jamaica | 0.1 /100 | #280 | Tragic $54,027 |
| Somalis | 0.1 /100 | #281 | Tragic $54,004 |
| Immigrants | Armenia | 0.1 /100 | #282 | Tragic $53,974 |
| Immigrants | Liberia | 0.1 /100 | #283 | Tragic $53,967 |
| Immigrants | Guatemala | 0.1 /100 | #284 | Tragic $53,950 |
| Mexicans | 0.1 /100 | #285 | Tragic $53,897 |
| Chippewa | 0.1 /100 | #286 | Tragic $53,847 |
| Immigrants | Barbados | 0.1 /100 | #287 | Tragic $53,766 |