Cuban vs Immigrants from Vietnam 12th Grade, No Diploma
COMPARE
Cuban
Immigrants from Vietnam
12th Grade, No Diploma
12th Grade, No Diploma Comparison
Cubans
Immigrants from Vietnam
88.9%
12TH GRADE, NO DIPLOMA
0.0/ 100
METRIC RATING
281st/ 347
METRIC RANK
88.7%
12TH GRADE, NO DIPLOMA
0.0/ 100
METRIC RATING
282nd/ 347
METRIC RANK
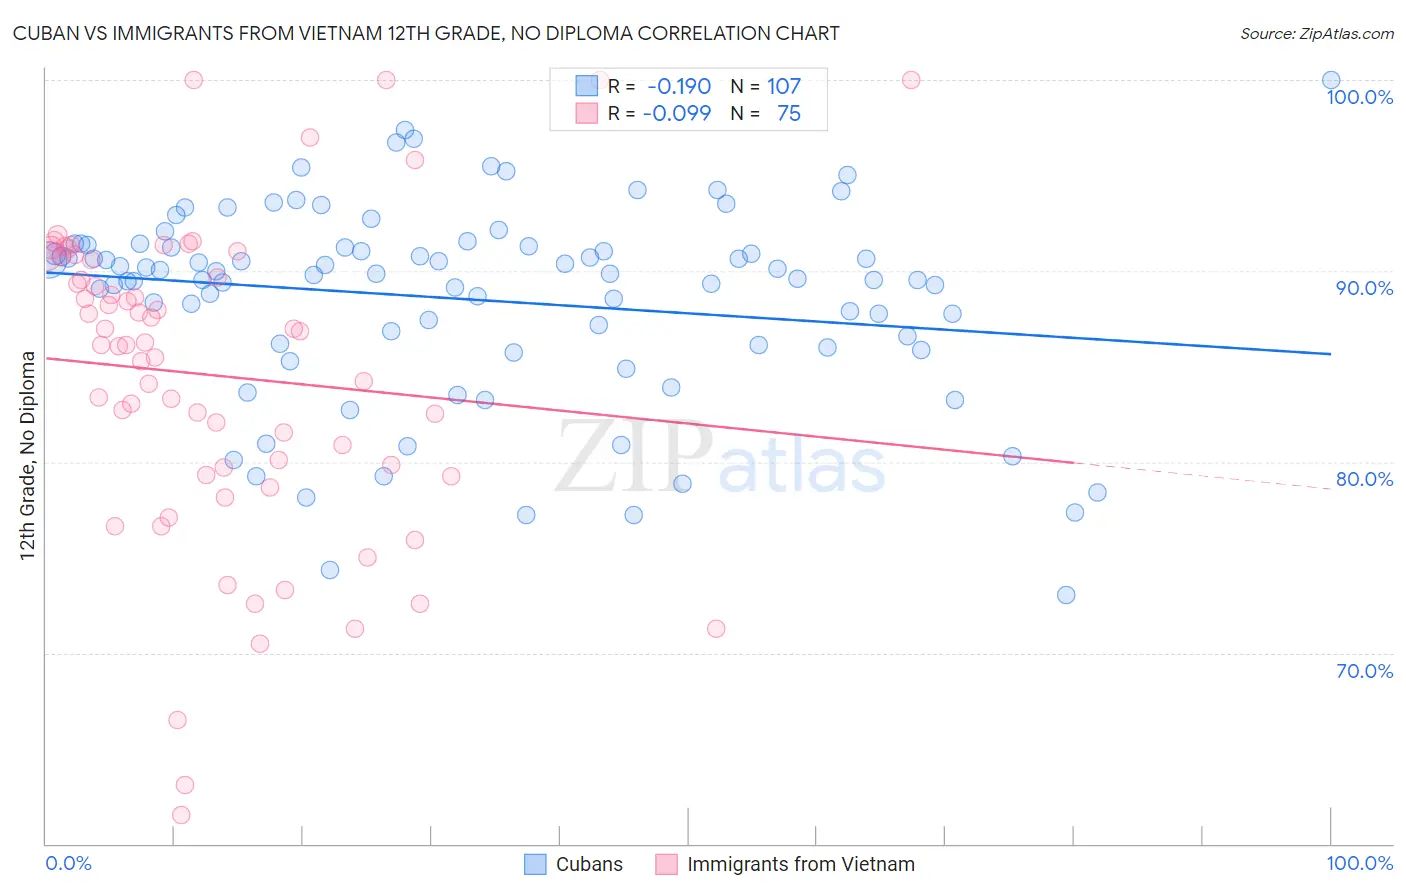
Cuban vs Immigrants from Vietnam 12th Grade, No Diploma Correlation Chart
The statistical analysis conducted on geographies consisting of 449,351,555 people shows a poor negative correlation between the proportion of Cubans and percentage of population with at least 12th grade (no diploma) education in the United States with a correlation coefficient (R) of -0.190 and weighted average of 88.9%. Similarly, the statistical analysis conducted on geographies consisting of 404,843,921 people shows a slight negative correlation between the proportion of Immigrants from Vietnam and percentage of population with at least 12th grade (no diploma) education in the United States with a correlation coefficient (R) of -0.099 and weighted average of 88.7%, a difference of 0.17%.
12th Grade, No Diploma Correlation Summary
| Measurement | Cuban | Immigrants from Vietnam |
| Minimum | 73.0% | 61.5% |
| Maximum | 100.0% | 100.0% |
| Range | 27.0% | 38.5% |
| Mean | 88.5% | 84.5% |
| Median | 89.8% | 86.1% |
| Interquartile 25% (IQ1) | 86.1% | 79.3% |
| Interquartile 75% (IQ3) | 91.3% | 90.7% |
| Interquartile Range (IQR) | 5.2% | 11.5% |
| Standard Deviation (Sample) | 5.2% | 8.3% |
| Standard Deviation (Population) | 5.2% | 8.2% |
Demographics Similar to Cubans and Immigrants from Vietnam by 12th Grade, No Diploma
In terms of 12th grade, no diploma, the demographic groups most similar to Cubans are Immigrants from Laos (88.9%, a difference of 0.010%), Immigrants from Burma/Myanmar (88.9%, a difference of 0.010%), Immigrants from St. Vincent and the Grenadines (88.9%, a difference of 0.080%), Immigrants from Barbados (89.0%, a difference of 0.15%), and Immigrants from Congo (89.0%, a difference of 0.20%). Similarly, the demographic groups most similar to Immigrants from Vietnam are Paiute (88.7%, a difference of 0.060%), Pennsylvania German (88.7%, a difference of 0.070%), Indonesian (88.6%, a difference of 0.080%), Immigrants from West Indies (88.6%, a difference of 0.090%), and Hopi (88.6%, a difference of 0.090%).
| Demographics | Rating | Rank | 12th Grade, No Diploma |
| Blacks/African Americans | 0.1 /100 | #271 | Tragic 89.3% |
| Malaysians | 0.1 /100 | #272 | Tragic 89.2% |
| Barbadians | 0.1 /100 | #273 | Tragic 89.1% |
| Cajuns | 0.1 /100 | #274 | Tragic 89.1% |
| Immigrants | Congo | 0.1 /100 | #275 | Tragic 89.0% |
| Ute | 0.1 /100 | #276 | Tragic 89.0% |
| Immigrants | Barbados | 0.0 /100 | #277 | Tragic 89.0% |
| Immigrants | St. Vincent and the Grenadines | 0.0 /100 | #278 | Tragic 88.9% |
| Immigrants | Laos | 0.0 /100 | #279 | Tragic 88.9% |
| Immigrants | Burma/Myanmar | 0.0 /100 | #280 | Tragic 88.9% |
| Cubans | 0.0 /100 | #281 | Tragic 88.9% |
| Immigrants | Vietnam | 0.0 /100 | #282 | Tragic 88.7% |
| Paiute | 0.0 /100 | #283 | Tragic 88.7% |
| Pennsylvania Germans | 0.0 /100 | #284 | Tragic 88.7% |
| Indonesians | 0.0 /100 | #285 | Tragic 88.6% |
| Immigrants | West Indies | 0.0 /100 | #286 | Tragic 88.6% |
| Hopi | 0.0 /100 | #287 | Tragic 88.6% |
| Immigrants | Fiji | 0.0 /100 | #288 | Tragic 88.6% |
| Dutch West Indians | 0.0 /100 | #289 | Tragic 88.5% |
| British West Indians | 0.0 /100 | #290 | Tragic 88.5% |
| Haitians | 0.0 /100 | #291 | Tragic 88.5% |