Cuban vs Immigrants from Somalia Family Households with Children
COMPARE
Cuban
Immigrants from Somalia
Family Households with Children
Family Households with Children Comparison
Cubans
Immigrants from Somalia
27.1%
FAMILY HOUSEHOLDS WITH CHILDREN
12.2/ 100
METRIC RATING
216th/ 347
METRIC RANK
26.3%
FAMILY HOUSEHOLDS WITH CHILDREN
0.0/ 100
METRIC RATING
309th/ 347
METRIC RANK
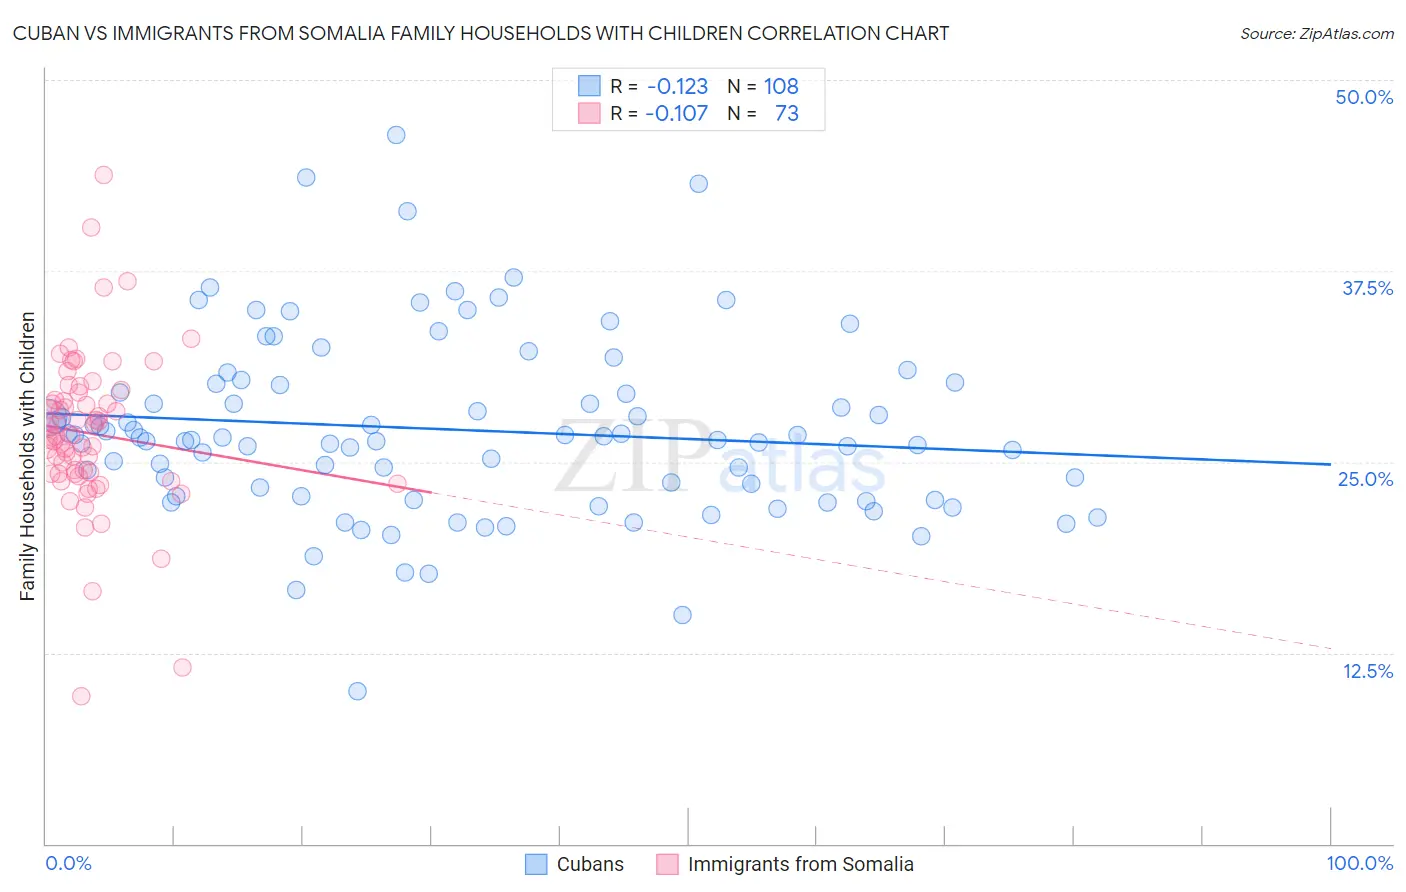
Cuban vs Immigrants from Somalia Family Households with Children Correlation Chart
The statistical analysis conducted on geographies consisting of 448,752,721 people shows a poor negative correlation between the proportion of Cubans and percentage of family households with children in the United States with a correlation coefficient (R) of -0.123 and weighted average of 27.1%. Similarly, the statistical analysis conducted on geographies consisting of 92,093,079 people shows a poor negative correlation between the proportion of Immigrants from Somalia and percentage of family households with children in the United States with a correlation coefficient (R) of -0.107 and weighted average of 26.3%, a difference of 3.4%.
Family Households with Children Correlation Summary
| Measurement | Cuban | Immigrants from Somalia |
| Minimum | 10.0% | 9.6% |
| Maximum | 46.4% | 43.8% |
| Range | 36.4% | 34.2% |
| Mean | 27.1% | 26.9% |
| Median | 26.5% | 26.7% |
| Interquartile 25% (IQ1) | 22.8% | 24.2% |
| Interquartile 75% (IQ3) | 30.1% | 29.3% |
| Interquartile Range (IQR) | 7.3% | 5.1% |
| Standard Deviation (Sample) | 6.0% | 5.2% |
| Standard Deviation (Population) | 6.0% | 5.2% |
Similar Demographics by Family Households with Children
Demographics Similar to Cubans by Family Households with Children
In terms of family households with children, the demographic groups most similar to Cubans are U.S. Virgin Islander (27.1%, a difference of 0.0%), Northern European (27.2%, a difference of 0.030%), African (27.2%, a difference of 0.040%), Greek (27.1%, a difference of 0.040%), and Immigrants from Dominica (27.2%, a difference of 0.080%).
| Demographics | Rating | Rank | Family Households with Children |
| Dutch West Indians | 15.8 /100 | #209 | Poor 27.2% |
| Immigrants | Ukraine | 14.4 /100 | #210 | Poor 27.2% |
| Welsh | 14.2 /100 | #211 | Poor 27.2% |
| Immigrants | Dominica | 13.9 /100 | #212 | Poor 27.2% |
| Okinawans | 13.7 /100 | #213 | Poor 27.2% |
| Africans | 13.0 /100 | #214 | Poor 27.2% |
| Northern Europeans | 12.8 /100 | #215 | Poor 27.2% |
| Cubans | 12.2 /100 | #216 | Poor 27.1% |
| U.S. Virgin Islanders | 12.1 /100 | #217 | Poor 27.1% |
| Greeks | 11.4 /100 | #218 | Poor 27.1% |
| Immigrants | Japan | 10.7 /100 | #219 | Poor 27.1% |
| Austrians | 9.9 /100 | #220 | Tragic 27.1% |
| New Zealanders | 9.6 /100 | #221 | Tragic 27.1% |
| Paraguayans | 9.4 /100 | #222 | Tragic 27.1% |
| Pima | 9.2 /100 | #223 | Tragic 27.1% |
Demographics Similar to Immigrants from Somalia by Family Households with Children
In terms of family households with children, the demographic groups most similar to Immigrants from Somalia are Marshallese (26.2%, a difference of 0.050%), Colville (26.2%, a difference of 0.090%), Lumbee (26.3%, a difference of 0.11%), West Indian (26.3%, a difference of 0.13%), and Immigrants from Czechoslovakia (26.2%, a difference of 0.16%).
| Demographics | Rating | Rank | Family Households with Children |
| Serbians | 0.1 /100 | #302 | Tragic 26.4% |
| Immigrants | Guyana | 0.1 /100 | #303 | Tragic 26.3% |
| Immigrants | Bahamas | 0.1 /100 | #304 | Tragic 26.3% |
| Guyanese | 0.1 /100 | #305 | Tragic 26.3% |
| Bermudans | 0.1 /100 | #306 | Tragic 26.3% |
| West Indians | 0.0 /100 | #307 | Tragic 26.3% |
| Lumbee | 0.0 /100 | #308 | Tragic 26.3% |
| Immigrants | Somalia | 0.0 /100 | #309 | Tragic 26.3% |
| Marshallese | 0.0 /100 | #310 | Tragic 26.2% |
| Colville | 0.0 /100 | #311 | Tragic 26.2% |
| Immigrants | Czechoslovakia | 0.0 /100 | #312 | Tragic 26.2% |
| Cree | 0.0 /100 | #313 | Tragic 26.2% |
| French Canadians | 0.0 /100 | #314 | Tragic 26.1% |
| Immigrants | Norway | 0.0 /100 | #315 | Tragic 26.1% |
| Estonians | 0.0 /100 | #316 | Tragic 26.1% |