French vs Slavic Per Capita Income
COMPARE
French
Slavic
Per Capita Income
Per Capita Income Comparison
French
Slavs
$43,685
PER CAPITA INCOME
50.7/ 100
METRIC RATING
173rd/ 347
METRIC RANK
$45,049
PER CAPITA INCOME
82.6/ 100
METRIC RATING
141st/ 347
METRIC RANK
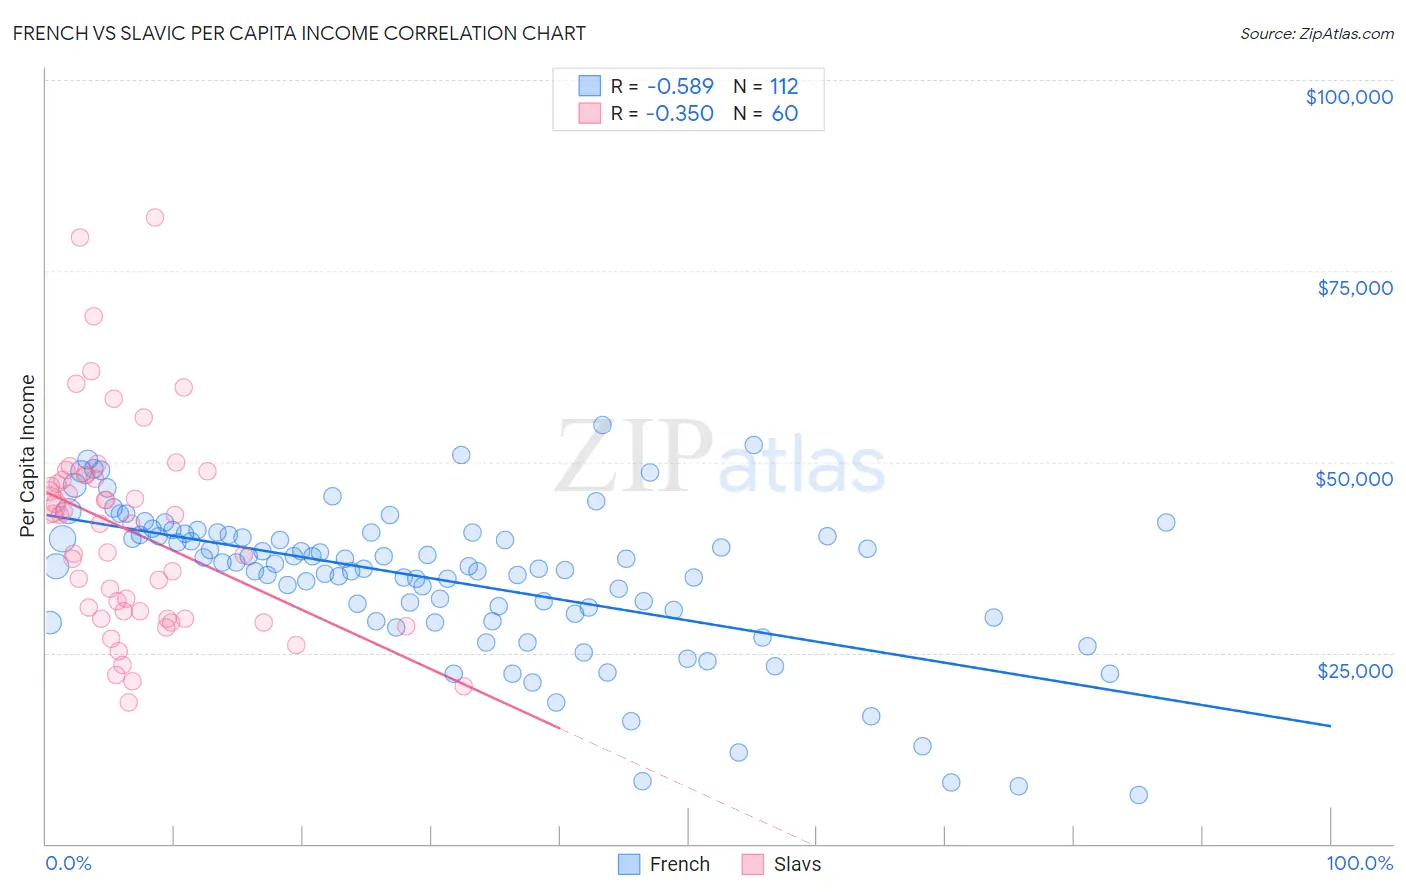
French vs Slavic Per Capita Income Correlation Chart
The statistical analysis conducted on geographies consisting of 572,484,193 people shows a substantial negative correlation between the proportion of French and per capita income in the United States with a correlation coefficient (R) of -0.589 and weighted average of $43,685. Similarly, the statistical analysis conducted on geographies consisting of 270,856,611 people shows a mild negative correlation between the proportion of Slavs and per capita income in the United States with a correlation coefficient (R) of -0.350 and weighted average of $45,049, a difference of 3.1%.
Per Capita Income Correlation Summary
| Measurement | French | Slavic |
| Minimum | $6,335 | $18,507 |
| Maximum | $54,853 | $81,943 |
| Range | $48,518 | $63,436 |
| Mean | $34,598 | $41,079 |
| Median | $36,348 | $42,528 |
| Interquartile 25% (IQ1) | $29,890 | $30,000 |
| Interquartile 75% (IQ3) | $40,437 | $48,077 |
| Interquartile Range (IQR) | $10,547 | $18,077 |
| Standard Deviation (Sample) | $9,750 | $13,481 |
| Standard Deviation (Population) | $9,706 | $13,368 |
Similar Demographics by Per Capita Income
Demographics Similar to French by Per Capita Income
In terms of per capita income, the demographic groups most similar to French are Colombian ($43,661, a difference of 0.060%), Celtic ($43,621, a difference of 0.15%), Czechoslovakian ($43,806, a difference of 0.28%), Immigrants from South Eastern Asia ($43,539, a difference of 0.34%), and Immigrants from Eastern Africa ($43,838, a difference of 0.35%).
| Demographics | Rating | Rank | Per Capita Income |
| Immigrants | Uruguay | 59.3 /100 | #166 | Average $43,997 |
| English | 58.9 /100 | #167 | Average $43,982 |
| Belgians | 58.1 /100 | #168 | Average $43,951 |
| Immigrants | Peru | 55.3 /100 | #169 | Average $43,852 |
| Scandinavians | 55.2 /100 | #170 | Average $43,848 |
| Immigrants | Eastern Africa | 54.9 /100 | #171 | Average $43,838 |
| Czechoslovakians | 54.1 /100 | #172 | Average $43,806 |
| French | 50.7 /100 | #173 | Average $43,685 |
| Colombians | 50.0 /100 | #174 | Average $43,661 |
| Celtics | 48.9 /100 | #175 | Average $43,621 |
| Immigrants | South Eastern Asia | 46.6 /100 | #176 | Average $43,539 |
| Tlingit-Haida | 45.9 /100 | #177 | Average $43,516 |
| Immigrants | Costa Rica | 44.5 /100 | #178 | Average $43,464 |
| Finns | 44.4 /100 | #179 | Average $43,461 |
| Sierra Leoneans | 42.9 /100 | #180 | Average $43,405 |
Demographics Similar to Slavs by Per Capita Income
In terms of per capita income, the demographic groups most similar to Slavs are Ugandan ($45,047, a difference of 0.0%), Immigrants from Uganda ($45,043, a difference of 0.010%), Immigrants from Jordan ($45,066, a difference of 0.040%), Basque ($45,086, a difference of 0.080%), and Icelander ($44,987, a difference of 0.14%).
| Demographics | Rating | Rank | Per Capita Income |
| Slovenes | 89.6 /100 | #134 | Excellent $45,581 |
| Hungarians | 87.9 /100 | #135 | Excellent $45,426 |
| Immigrants | Oceania | 85.2 /100 | #136 | Excellent $45,220 |
| Immigrants | Syria | 85.2 /100 | #137 | Excellent $45,218 |
| Assyrians/Chaldeans/Syriacs | 84.8 /100 | #138 | Excellent $45,195 |
| Basques | 83.2 /100 | #139 | Excellent $45,086 |
| Immigrants | Jordan | 82.9 /100 | #140 | Excellent $45,066 |
| Slavs | 82.6 /100 | #141 | Excellent $45,049 |
| Ugandans | 82.6 /100 | #142 | Excellent $45,047 |
| Immigrants | Uganda | 82.5 /100 | #143 | Excellent $45,043 |
| Icelanders | 81.6 /100 | #144 | Excellent $44,987 |
| Immigrants | Afghanistan | 78.0 /100 | #145 | Good $44,790 |
| Irish | 75.8 /100 | #146 | Good $44,679 |
| Czechs | 74.1 /100 | #147 | Good $44,595 |
| Immigrants | Armenia | 73.1 /100 | #148 | Good $44,552 |