Comanche vs Ecuadorian Householder Income Under 25 years
COMPARE
Comanche
Ecuadorian
Householder Income Under 25 years
Householder Income Under 25 years Comparison
Comanche
Ecuadorians
$47,518
HOUSEHOLDER INCOME UNDER 25 YEARS
0.0/ 100
METRIC RATING
308th/ 347
METRIC RANK
$53,911
HOUSEHOLDER INCOME UNDER 25 YEARS
98.5/ 100
METRIC RATING
102nd/ 347
METRIC RANK
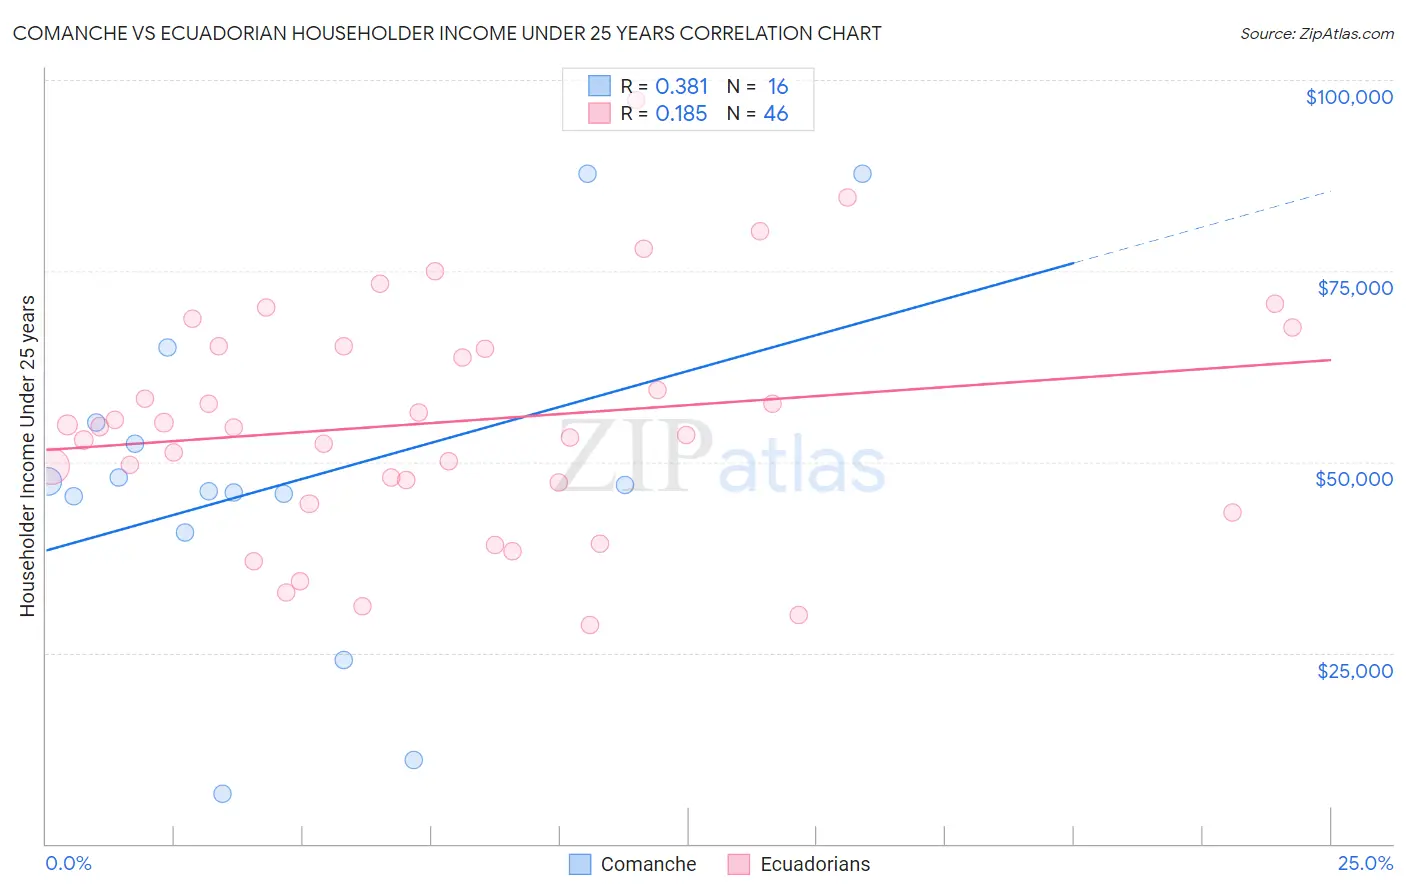
Comanche vs Ecuadorian Householder Income Under 25 years Correlation Chart
The statistical analysis conducted on geographies consisting of 103,551,593 people shows a mild positive correlation between the proportion of Comanche and household income with householder under the age of 25 in the United States with a correlation coefficient (R) of 0.381 and weighted average of $47,518. Similarly, the statistical analysis conducted on geographies consisting of 271,738,098 people shows a poor positive correlation between the proportion of Ecuadorians and household income with householder under the age of 25 in the United States with a correlation coefficient (R) of 0.185 and weighted average of $53,911, a difference of 13.5%.
Householder Income Under 25 years Correlation Summary
| Measurement | Comanche | Ecuadorian |
| Minimum | $6,484 | $28,576 |
| Maximum | $87,727 | $97,399 |
| Range | $81,243 | $68,823 |
| Mean | $47,234 | $55,256 |
| Median | $46,529 | $54,589 |
| Interquartile 25% (IQ1) | $43,131 | $47,259 |
| Interquartile 75% (IQ3) | $53,745 | $65,102 |
| Interquartile Range (IQR) | $10,614 | $17,843 |
| Standard Deviation (Sample) | $21,985 | $15,099 |
| Standard Deviation (Population) | $21,287 | $14,934 |
Similar Demographics by Householder Income Under 25 years
Demographics Similar to Comanche by Householder Income Under 25 years
In terms of householder income under 25 years, the demographic groups most similar to Comanche are Bangladeshi ($47,589, a difference of 0.15%), U.S. Virgin Islander ($47,448, a difference of 0.15%), Iroquois ($47,380, a difference of 0.29%), Ottawa ($47,366, a difference of 0.32%), and Bermudan ($47,359, a difference of 0.34%).
| Demographics | Rating | Rank | Householder Income Under 25 years |
| Immigrants | Kuwait | 0.0 /100 | #301 | Tragic $48,126 |
| Immigrants | Liberia | 0.0 /100 | #302 | Tragic $47,981 |
| Immigrants | Middle Africa | 0.0 /100 | #303 | Tragic $47,916 |
| Menominee | 0.0 /100 | #304 | Tragic $47,907 |
| Cherokee | 0.0 /100 | #305 | Tragic $47,848 |
| Natives/Alaskans | 0.0 /100 | #306 | Tragic $47,704 |
| Bangladeshis | 0.0 /100 | #307 | Tragic $47,589 |
| Comanche | 0.0 /100 | #308 | Tragic $47,518 |
| U.S. Virgin Islanders | 0.0 /100 | #309 | Tragic $47,448 |
| Iroquois | 0.0 /100 | #310 | Tragic $47,380 |
| Ottawa | 0.0 /100 | #311 | Tragic $47,366 |
| Bermudans | 0.0 /100 | #312 | Tragic $47,359 |
| Delaware | 0.0 /100 | #313 | Tragic $47,159 |
| Chippewa | 0.0 /100 | #314 | Tragic $47,015 |
| Crow | 0.0 /100 | #315 | Tragic $47,012 |
Demographics Similar to Ecuadorians by Householder Income Under 25 years
In terms of householder income under 25 years, the demographic groups most similar to Ecuadorians are South American ($53,939, a difference of 0.050%), Ukrainian ($53,843, a difference of 0.13%), Immigrants from Kazakhstan ($53,990, a difference of 0.15%), Alaska Native ($54,000, a difference of 0.16%), and Ethiopian ($53,818, a difference of 0.17%).
| Demographics | Rating | Rank | Householder Income Under 25 years |
| Immigrants | Malaysia | 99.2 /100 | #95 | Exceptional $54,179 |
| Argentineans | 99.2 /100 | #96 | Exceptional $54,154 |
| Immigrants | Portugal | 99.1 /100 | #97 | Exceptional $54,105 |
| Eastern Europeans | 99.0 /100 | #98 | Exceptional $54,066 |
| Alaska Natives | 98.8 /100 | #99 | Exceptional $54,000 |
| Immigrants | Kazakhstan | 98.8 /100 | #100 | Exceptional $53,990 |
| South Americans | 98.6 /100 | #101 | Exceptional $53,939 |
| Ecuadorians | 98.5 /100 | #102 | Exceptional $53,911 |
| Ukrainians | 98.3 /100 | #103 | Exceptional $53,843 |
| Ethiopians | 98.2 /100 | #104 | Exceptional $53,818 |
| Immigrants | France | 98.1 /100 | #105 | Exceptional $53,805 |
| Albanians | 98.1 /100 | #106 | Exceptional $53,794 |
| Australians | 97.8 /100 | #107 | Exceptional $53,739 |
| Maltese | 97.8 /100 | #108 | Exceptional $53,735 |
| Immigrants | Ecuador | 97.7 /100 | #109 | Exceptional $53,722 |