Comanche vs Sri Lankan Householder Income Under 25 years
COMPARE
Comanche
Sri Lankan
Householder Income Under 25 years
Householder Income Under 25 years Comparison
Comanche
Sri Lankans
$47,518
HOUSEHOLDER INCOME UNDER 25 YEARS
0.0/ 100
METRIC RATING
308th/ 347
METRIC RANK
$55,470
HOUSEHOLDER INCOME UNDER 25 YEARS
100.0/ 100
METRIC RATING
54th/ 347
METRIC RANK
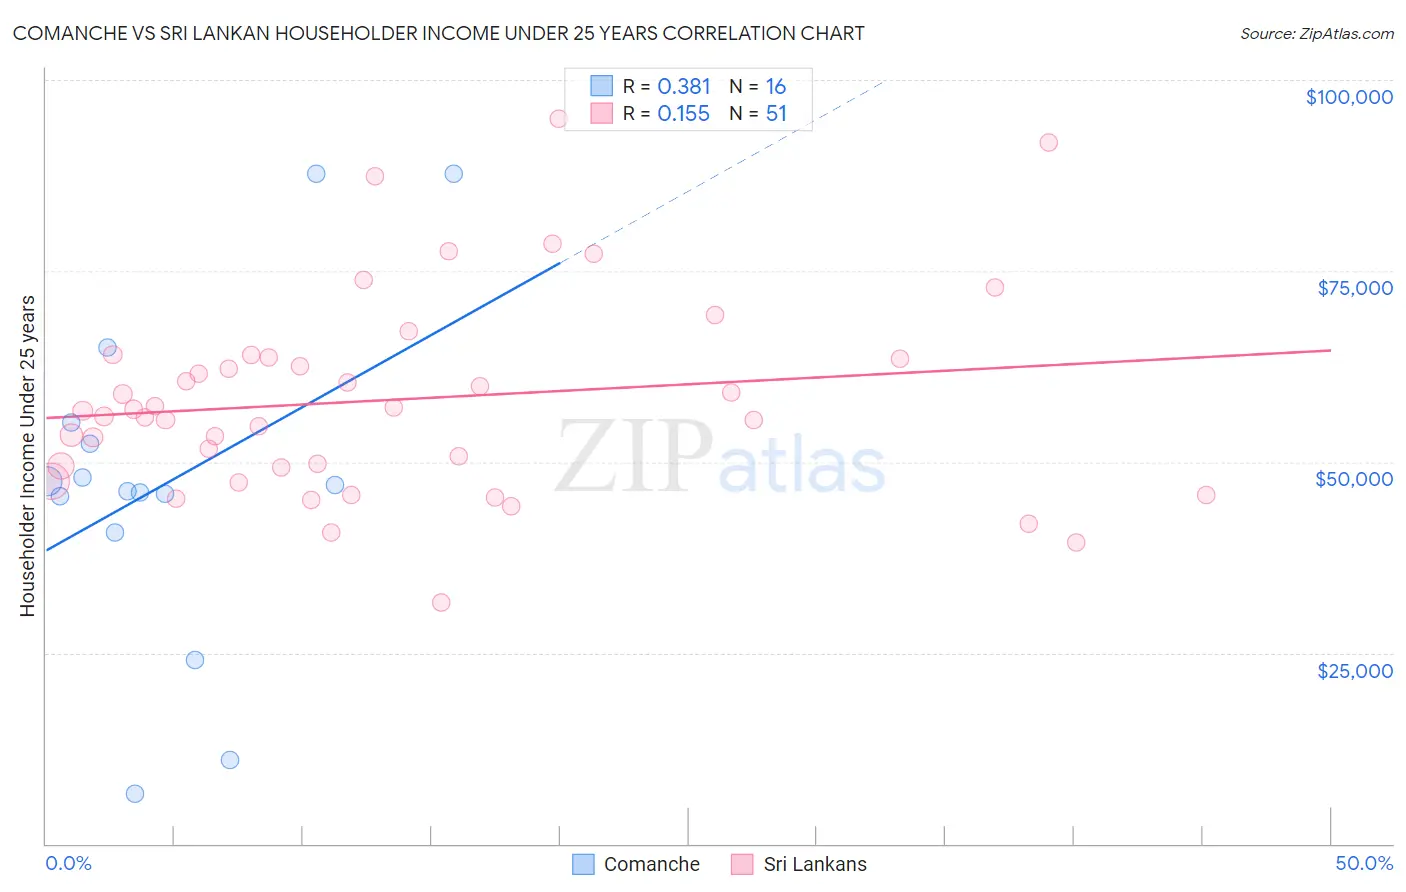
Comanche vs Sri Lankan Householder Income Under 25 years Correlation Chart
The statistical analysis conducted on geographies consisting of 103,551,593 people shows a mild positive correlation between the proportion of Comanche and household income with householder under the age of 25 in the United States with a correlation coefficient (R) of 0.381 and weighted average of $47,518. Similarly, the statistical analysis conducted on geographies consisting of 370,884,989 people shows a poor positive correlation between the proportion of Sri Lankans and household income with householder under the age of 25 in the United States with a correlation coefficient (R) of 0.155 and weighted average of $55,470, a difference of 16.7%.
Householder Income Under 25 years Correlation Summary
| Measurement | Comanche | Sri Lankan |
| Minimum | $6,484 | $31,569 |
| Maximum | $87,727 | $94,955 |
| Range | $81,243 | $63,386 |
| Mean | $47,234 | $58,171 |
| Median | $46,529 | $56,661 |
| Interquartile 25% (IQ1) | $43,131 | $49,199 |
| Interquartile 75% (IQ3) | $53,745 | $63,744 |
| Interquartile Range (IQR) | $10,614 | $14,546 |
| Standard Deviation (Sample) | $21,985 | $13,154 |
| Standard Deviation (Population) | $21,287 | $13,025 |
Similar Demographics by Householder Income Under 25 years
Demographics Similar to Comanche by Householder Income Under 25 years
In terms of householder income under 25 years, the demographic groups most similar to Comanche are Bangladeshi ($47,589, a difference of 0.15%), U.S. Virgin Islander ($47,448, a difference of 0.15%), Iroquois ($47,380, a difference of 0.29%), Ottawa ($47,366, a difference of 0.32%), and Bermudan ($47,359, a difference of 0.34%).
| Demographics | Rating | Rank | Householder Income Under 25 years |
| Immigrants | Kuwait | 0.0 /100 | #301 | Tragic $48,126 |
| Immigrants | Liberia | 0.0 /100 | #302 | Tragic $47,981 |
| Immigrants | Middle Africa | 0.0 /100 | #303 | Tragic $47,916 |
| Menominee | 0.0 /100 | #304 | Tragic $47,907 |
| Cherokee | 0.0 /100 | #305 | Tragic $47,848 |
| Natives/Alaskans | 0.0 /100 | #306 | Tragic $47,704 |
| Bangladeshis | 0.0 /100 | #307 | Tragic $47,589 |
| Comanche | 0.0 /100 | #308 | Tragic $47,518 |
| U.S. Virgin Islanders | 0.0 /100 | #309 | Tragic $47,448 |
| Iroquois | 0.0 /100 | #310 | Tragic $47,380 |
| Ottawa | 0.0 /100 | #311 | Tragic $47,366 |
| Bermudans | 0.0 /100 | #312 | Tragic $47,359 |
| Delaware | 0.0 /100 | #313 | Tragic $47,159 |
| Chippewa | 0.0 /100 | #314 | Tragic $47,015 |
| Crow | 0.0 /100 | #315 | Tragic $47,012 |
Demographics Similar to Sri Lankans by Householder Income Under 25 years
In terms of householder income under 25 years, the demographic groups most similar to Sri Lankans are Immigrants from Poland ($55,474, a difference of 0.010%), Immigrants from Ukraine ($55,447, a difference of 0.040%), Immigrants from Romania ($55,522, a difference of 0.090%), Immigrants from Indonesia ($55,521, a difference of 0.090%), and Salvadoran ($55,412, a difference of 0.10%).
| Demographics | Rating | Rank | Householder Income Under 25 years |
| Cambodians | 100.0 /100 | #47 | Exceptional $55,571 |
| Immigrants | Vietnam | 100.0 /100 | #48 | Exceptional $55,562 |
| Iranians | 100.0 /100 | #49 | Exceptional $55,548 |
| Puget Sound Salish | 100.0 /100 | #50 | Exceptional $55,543 |
| Immigrants | Romania | 100.0 /100 | #51 | Exceptional $55,522 |
| Immigrants | Indonesia | 100.0 /100 | #52 | Exceptional $55,521 |
| Immigrants | Poland | 100.0 /100 | #53 | Exceptional $55,474 |
| Sri Lankans | 100.0 /100 | #54 | Exceptional $55,470 |
| Immigrants | Ukraine | 100.0 /100 | #55 | Exceptional $55,447 |
| Salvadorans | 100.0 /100 | #56 | Exceptional $55,412 |
| Soviet Union | 100.0 /100 | #57 | Exceptional $55,340 |
| Guyanese | 99.9 /100 | #58 | Exceptional $55,210 |
| Native Hawaiians | 99.9 /100 | #59 | Exceptional $55,158 |
| Immigrants | Lithuania | 99.9 /100 | #60 | Exceptional $55,028 |
| Immigrants | Europe | 99.9 /100 | #61 | Exceptional $55,022 |