Comanche vs Immigrants from Yemen Householder Income Over 65 years
COMPARE
Comanche
Immigrants from Yemen
Householder Income Over 65 years
Householder Income Over 65 years Comparison
Comanche
Immigrants from Yemen
$54,922
HOUSEHOLDER INCOME OVER 65 YEARS
0.2/ 100
METRIC RATING
261st/ 347
METRIC RANK
$47,527
HOUSEHOLDER INCOME OVER 65 YEARS
0.0/ 100
METRIC RATING
340th/ 347
METRIC RANK
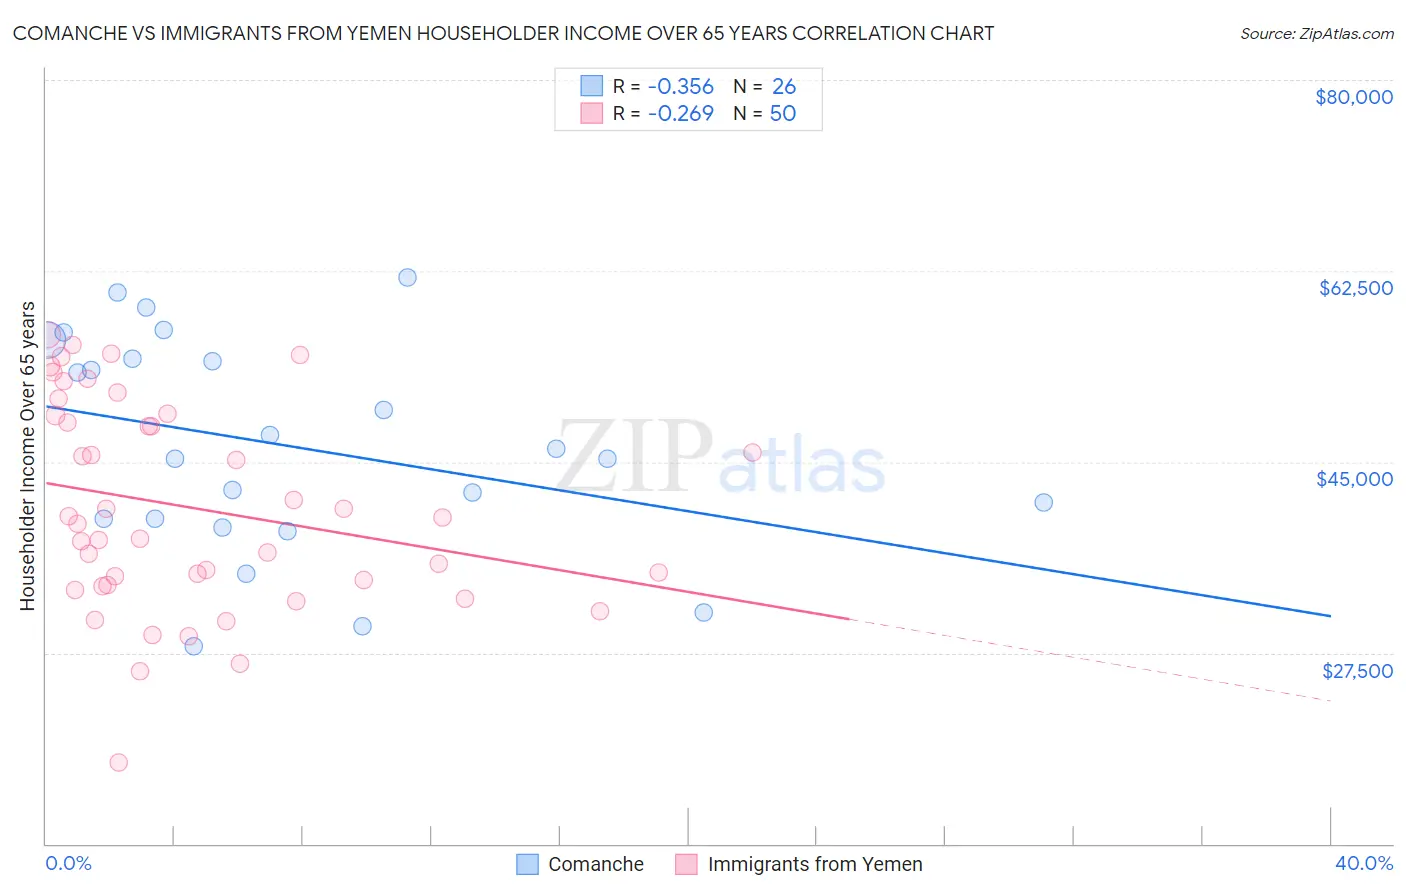
Comanche vs Immigrants from Yemen Householder Income Over 65 years Correlation Chart
The statistical analysis conducted on geographies consisting of 109,617,596 people shows a mild negative correlation between the proportion of Comanche and household income with householder over the age of 65 in the United States with a correlation coefficient (R) of -0.356 and weighted average of $54,922. Similarly, the statistical analysis conducted on geographies consisting of 82,406,704 people shows a weak negative correlation between the proportion of Immigrants from Yemen and household income with householder over the age of 65 in the United States with a correlation coefficient (R) of -0.269 and weighted average of $47,527, a difference of 15.6%.
Householder Income Over 65 years Correlation Summary
| Measurement | Comanche | Immigrants from Yemen |
| Minimum | $28,127 | $17,404 |
| Maximum | $61,875 | $56,646 |
| Range | $33,748 | $39,242 |
| Mean | $46,472 | $40,803 |
| Median | $45,782 | $39,631 |
| Interquartile 25% (IQ1) | $39,810 | $33,662 |
| Interquartile 75% (IQ3) | $54,432 | $49,266 |
| Interquartile Range (IQR) | $14,621 | $15,604 |
| Standard Deviation (Sample) | $9,777 | $9,491 |
| Standard Deviation (Population) | $9,587 | $9,395 |
Similar Demographics by Householder Income Over 65 years
Demographics Similar to Comanche by Householder Income Over 65 years
In terms of householder income over 65 years, the demographic groups most similar to Comanche are Immigrants from West Indies ($54,927, a difference of 0.010%), West Indian ($54,936, a difference of 0.030%), Ecuadorian ($54,958, a difference of 0.070%), Bangladeshi ($54,719, a difference of 0.37%), and French American Indian ($54,699, a difference of 0.41%).
| Demographics | Rating | Rank | Householder Income Over 65 years |
| Americans | 0.3 /100 | #254 | Tragic $55,527 |
| Immigrants | Bangladesh | 0.3 /100 | #255 | Tragic $55,394 |
| German Russians | 0.3 /100 | #256 | Tragic $55,356 |
| Trinidadians and Tobagonians | 0.3 /100 | #257 | Tragic $55,327 |
| Ecuadorians | 0.2 /100 | #258 | Tragic $54,958 |
| West Indians | 0.2 /100 | #259 | Tragic $54,936 |
| Immigrants | West Indies | 0.2 /100 | #260 | Tragic $54,927 |
| Comanche | 0.2 /100 | #261 | Tragic $54,922 |
| Bangladeshis | 0.1 /100 | #262 | Tragic $54,719 |
| French American Indians | 0.1 /100 | #263 | Tragic $54,699 |
| Apache | 0.1 /100 | #264 | Tragic $54,668 |
| Belizeans | 0.1 /100 | #265 | Tragic $54,580 |
| Jamaicans | 0.1 /100 | #266 | Tragic $54,560 |
| Guatemalans | 0.1 /100 | #267 | Tragic $54,526 |
| Immigrants | Zaire | 0.1 /100 | #268 | Tragic $54,512 |
Demographics Similar to Immigrants from Yemen by Householder Income Over 65 years
In terms of householder income over 65 years, the demographic groups most similar to Immigrants from Yemen are Navajo ($47,722, a difference of 0.41%), Dominican ($46,964, a difference of 1.2%), Immigrants from Cabo Verde ($46,654, a difference of 1.9%), Immigrants from Caribbean ($48,535, a difference of 2.1%), and Tohono O'odham ($49,121, a difference of 3.4%).
| Demographics | Rating | Rank | Householder Income Over 65 years |
| Cape Verdeans | 0.0 /100 | #333 | Tragic $50,077 |
| Immigrants | Dominica | 0.0 /100 | #334 | Tragic $50,071 |
| Crow | 0.0 /100 | #335 | Tragic $49,234 |
| Cubans | 0.0 /100 | #336 | Tragic $49,152 |
| Tohono O'odham | 0.0 /100 | #337 | Tragic $49,121 |
| Immigrants | Caribbean | 0.0 /100 | #338 | Tragic $48,535 |
| Navajo | 0.0 /100 | #339 | Tragic $47,722 |
| Immigrants | Yemen | 0.0 /100 | #340 | Tragic $47,527 |
| Dominicans | 0.0 /100 | #341 | Tragic $46,964 |
| Immigrants | Cabo Verde | 0.0 /100 | #342 | Tragic $46,654 |
| Immigrants | Dominican Republic | 0.0 /100 | #343 | Tragic $45,758 |
| Houma | 0.0 /100 | #344 | Tragic $44,822 |
| Immigrants | Cuba | 0.0 /100 | #345 | Tragic $44,735 |
| Puerto Ricans | 0.0 /100 | #346 | Tragic $42,550 |
| Lumbee | 0.0 /100 | #347 | Tragic $40,550 |