Colville vs Immigrants from Kazakhstan Householder Income Ages 25 - 44 years
COMPARE
Colville
Immigrants from Kazakhstan
Householder Income Ages 25 - 44 years
Householder Income Ages 25 - 44 years Comparison
Colville
Immigrants from Kazakhstan
$82,604
HOUSEHOLDER INCOME AGES 25 - 44 YEARS
0.1/ 100
METRIC RATING
280th/ 347
METRIC RANK
$101,727
HOUSEHOLDER INCOME AGES 25 - 44 YEARS
98.1/ 100
METRIC RATING
98th/ 347
METRIC RANK
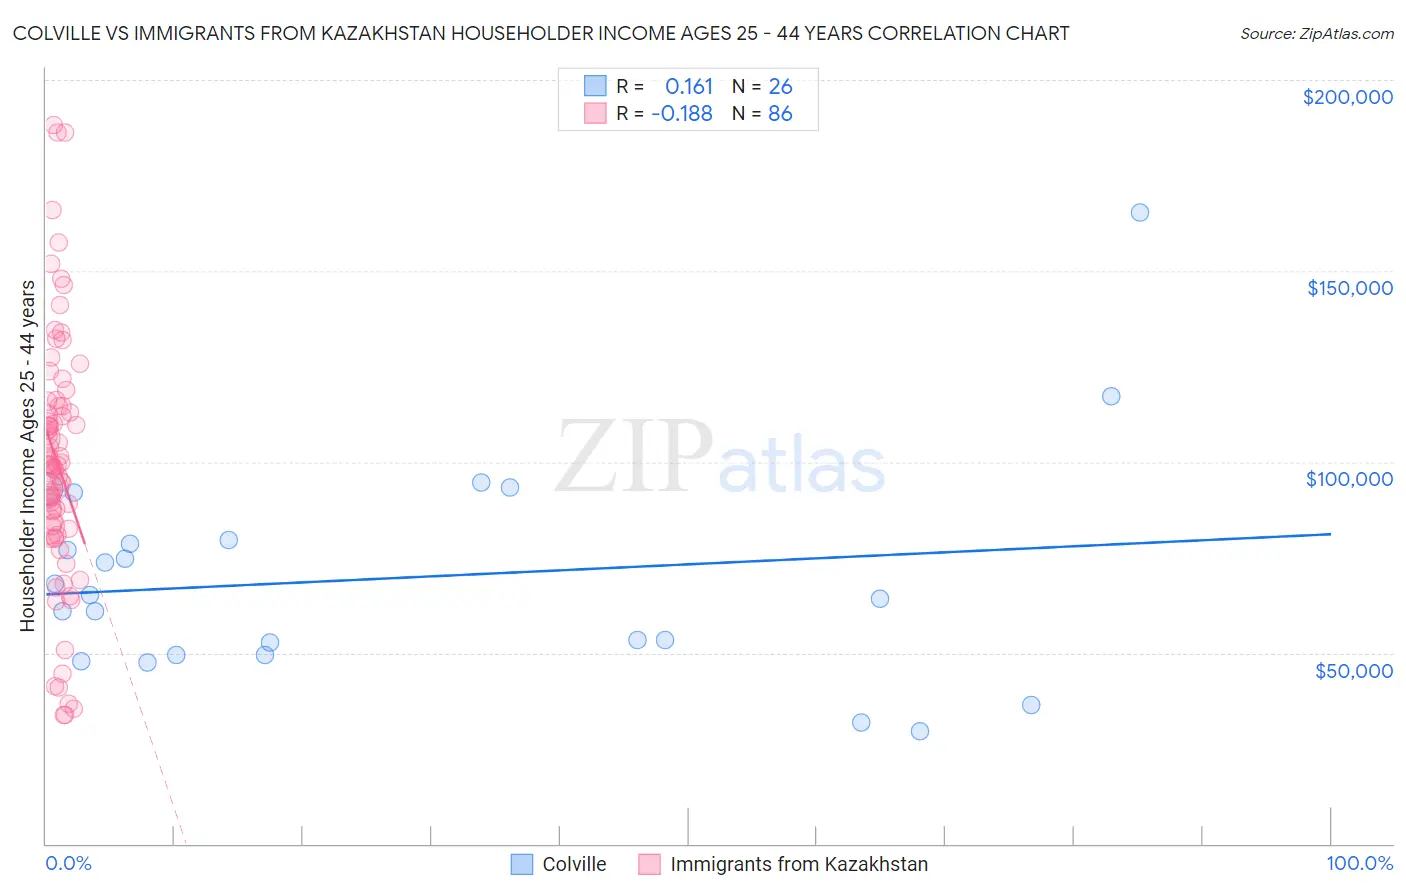
Colville vs Immigrants from Kazakhstan Householder Income Ages 25 - 44 years Correlation Chart
The statistical analysis conducted on geographies consisting of 34,657,772 people shows a poor positive correlation between the proportion of Colville and household income with householder between the ages 25 and 44 in the United States with a correlation coefficient (R) of 0.161 and weighted average of $82,604. Similarly, the statistical analysis conducted on geographies consisting of 124,395,234 people shows a poor negative correlation between the proportion of Immigrants from Kazakhstan and household income with householder between the ages 25 and 44 in the United States with a correlation coefficient (R) of -0.188 and weighted average of $101,727, a difference of 23.2%.
Householder Income Ages 25 - 44 years Correlation Summary
| Measurement | Colville | Immigrants from Kazakhstan |
| Minimum | $29,375 | $33,710 |
| Maximum | $165,278 | $188,234 |
| Range | $135,903 | $154,524 |
| Mean | $69,577 | $99,834 |
| Median | $64,641 | $98,784 |
| Interquartile 25% (IQ1) | $49,583 | $83,191 |
| Interquartile 75% (IQ3) | $79,688 | $114,592 |
| Interquartile Range (IQR) | $30,105 | $31,401 |
| Standard Deviation (Sample) | $28,891 | $32,549 |
| Standard Deviation (Population) | $28,330 | $32,360 |
Similar Demographics by Householder Income Ages 25 - 44 years
Demographics Similar to Colville by Householder Income Ages 25 - 44 years
In terms of householder income ages 25 - 44 years, the demographic groups most similar to Colville are Pima ($82,821, a difference of 0.26%), Cajun ($82,393, a difference of 0.26%), Senegalese ($82,852, a difference of 0.30%), Central American Indian ($82,355, a difference of 0.30%), and Guatemalan ($82,331, a difference of 0.33%).
| Demographics | Rating | Rank | Householder Income Ages 25 - 44 years |
| Iroquois | 0.2 /100 | #273 | Tragic $83,682 |
| Marshallese | 0.2 /100 | #274 | Tragic $83,575 |
| Immigrants | Jamaica | 0.2 /100 | #275 | Tragic $83,298 |
| Immigrants | Belize | 0.2 /100 | #276 | Tragic $83,141 |
| Paiute | 0.2 /100 | #277 | Tragic $82,984 |
| Senegalese | 0.2 /100 | #278 | Tragic $82,852 |
| Pima | 0.1 /100 | #279 | Tragic $82,821 |
| Colville | 0.1 /100 | #280 | Tragic $82,604 |
| Cajuns | 0.1 /100 | #281 | Tragic $82,393 |
| Central American Indians | 0.1 /100 | #282 | Tragic $82,355 |
| Guatemalans | 0.1 /100 | #283 | Tragic $82,331 |
| Immigrants | Middle Africa | 0.1 /100 | #284 | Tragic $82,254 |
| Immigrants | Somalia | 0.1 /100 | #285 | Tragic $82,188 |
| Ute | 0.1 /100 | #286 | Tragic $82,166 |
| Immigrants | Latin America | 0.1 /100 | #287 | Tragic $82,166 |
Demographics Similar to Immigrants from Kazakhstan by Householder Income Ages 25 - 44 years
In terms of householder income ages 25 - 44 years, the demographic groups most similar to Immigrants from Kazakhstan are Austrian ($101,842, a difference of 0.11%), Macedonian ($101,882, a difference of 0.15%), Assyrian/Chaldean/Syriac ($101,936, a difference of 0.21%), Sri Lankan ($101,960, a difference of 0.23%), and Taiwanese ($101,492, a difference of 0.23%).
| Demographics | Rating | Rank | Householder Income Ages 25 - 44 years |
| Croatians | 98.7 /100 | #91 | Exceptional $102,414 |
| Immigrants | North America | 98.7 /100 | #92 | Exceptional $102,407 |
| Immigrants | England | 98.4 /100 | #93 | Exceptional $102,020 |
| Sri Lankans | 98.4 /100 | #94 | Exceptional $101,960 |
| Assyrians/Chaldeans/Syriacs | 98.3 /100 | #95 | Exceptional $101,936 |
| Macedonians | 98.3 /100 | #96 | Exceptional $101,882 |
| Austrians | 98.3 /100 | #97 | Exceptional $101,842 |
| Immigrants | Kazakhstan | 98.1 /100 | #98 | Exceptional $101,727 |
| Taiwanese | 97.9 /100 | #99 | Exceptional $101,492 |
| Immigrants | Argentina | 97.8 /100 | #100 | Exceptional $101,415 |
| Albanians | 97.8 /100 | #101 | Exceptional $101,367 |
| Immigrants | Lebanon | 97.4 /100 | #102 | Exceptional $101,124 |
| Immigrants | Moldova | 97.4 /100 | #103 | Exceptional $101,091 |
| Immigrants | Poland | 97.4 /100 | #104 | Exceptional $101,065 |
| Immigrants | Vietnam | 96.5 /100 | #105 | Exceptional $100,535 |