Eastern European vs Italian Householder Income Ages 45 - 64 years
COMPARE
Eastern European
Italian
Householder Income Ages 45 - 64 years
Householder Income Ages 45 - 64 years Comparison
Eastern Europeans
Italians
$120,684
HOUSEHOLDER INCOME AGES 45 - 64 YEARS
100.0/ 100
METRIC RATING
19th/ 347
METRIC RANK
$110,224
HOUSEHOLDER INCOME AGES 45 - 64 YEARS
99.3/ 100
METRIC RATING
71st/ 347
METRIC RANK
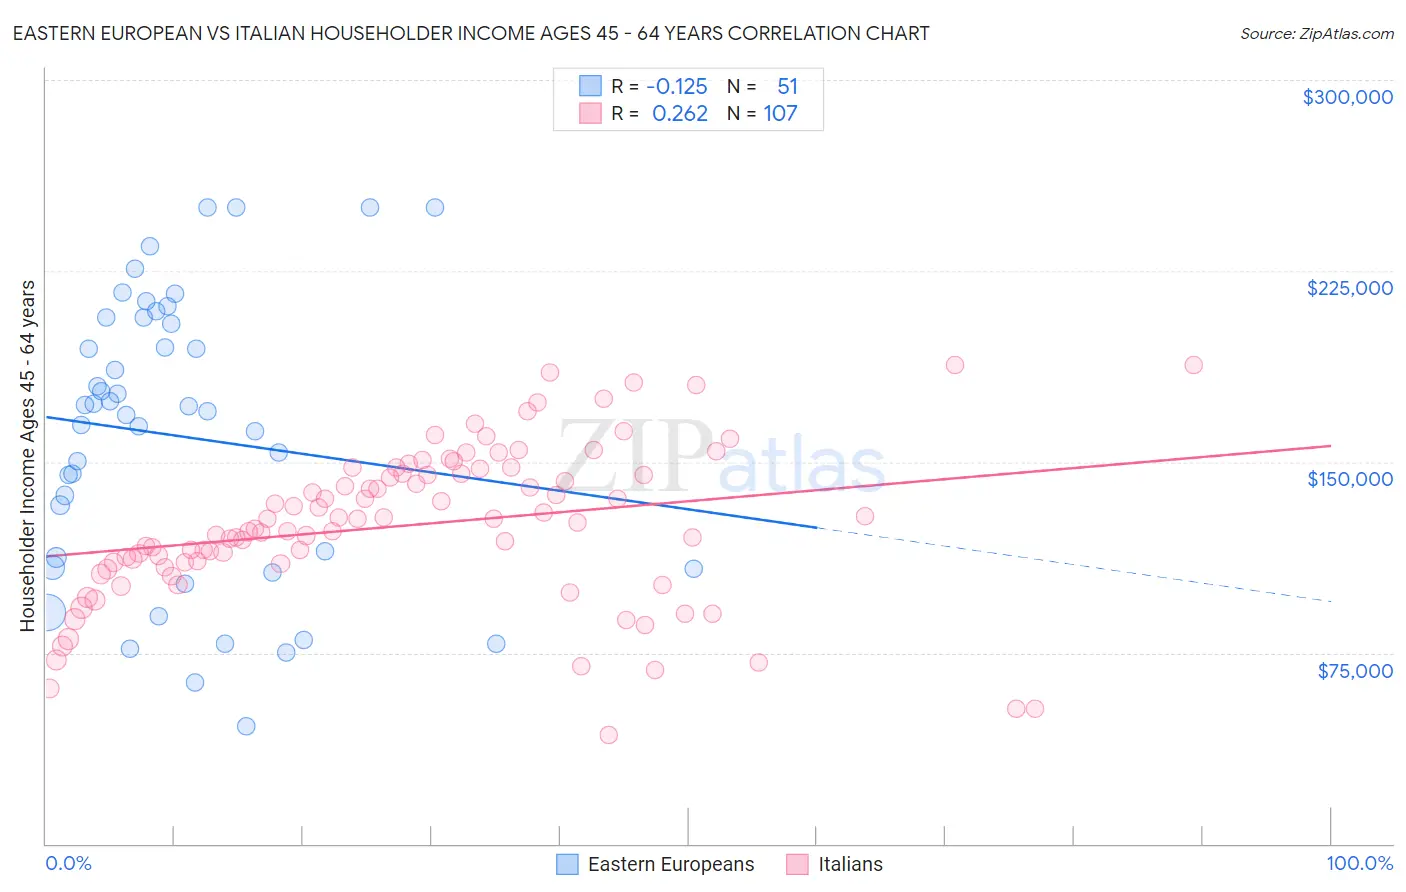
Eastern European vs Italian Householder Income Ages 45 - 64 years Correlation Chart
The statistical analysis conducted on geographies consisting of 460,234,248 people shows a poor negative correlation between the proportion of Eastern Europeans and household income with householder between the ages 45 and 64 in the United States with a correlation coefficient (R) of -0.125 and weighted average of $120,684. Similarly, the statistical analysis conducted on geographies consisting of 571,010,703 people shows a weak positive correlation between the proportion of Italians and household income with householder between the ages 45 and 64 in the United States with a correlation coefficient (R) of 0.262 and weighted average of $110,224, a difference of 9.5%.
Householder Income Ages 45 - 64 years Correlation Summary
| Measurement | Eastern European | Italian |
| Minimum | $46,087 | $42,562 |
| Maximum | $250,001 | $188,030 |
| Range | $203,914 | $145,468 |
| Mean | $160,074 | $125,039 |
| Median | $169,721 | $126,199 |
| Interquartile 25% (IQ1) | $108,414 | $109,794 |
| Interquartile 75% (IQ3) | $206,658 | $145,518 |
| Interquartile Range (IQR) | $98,244 | $35,724 |
| Standard Deviation (Sample) | $55,229 | $30,277 |
| Standard Deviation (Population) | $54,685 | $30,135 |
Similar Demographics by Householder Income Ages 45 - 64 years
Demographics Similar to Eastern Europeans by Householder Income Ages 45 - 64 years
In terms of householder income ages 45 - 64 years, the demographic groups most similar to Eastern Europeans are Immigrants from Korea ($121,243, a difference of 0.46%), Burmese ($121,444, a difference of 0.63%), Immigrants from Australia ($119,308, a difference of 1.1%), Immigrants from China ($122,178, a difference of 1.2%), and Immigrants from Eastern Asia ($122,222, a difference of 1.3%).
| Demographics | Rating | Rank | Householder Income Ages 45 - 64 years |
| Immigrants | Israel | 100.0 /100 | #12 | Exceptional $122,893 |
| Immigrants | Ireland | 100.0 /100 | #13 | Exceptional $122,757 |
| Indians (Asian) | 100.0 /100 | #14 | Exceptional $122,343 |
| Immigrants | Eastern Asia | 100.0 /100 | #15 | Exceptional $122,222 |
| Immigrants | China | 100.0 /100 | #16 | Exceptional $122,178 |
| Burmese | 100.0 /100 | #17 | Exceptional $121,444 |
| Immigrants | Korea | 100.0 /100 | #18 | Exceptional $121,243 |
| Eastern Europeans | 100.0 /100 | #19 | Exceptional $120,684 |
| Immigrants | Australia | 100.0 /100 | #20 | Exceptional $119,308 |
| Immigrants | Sri Lanka | 100.0 /100 | #21 | Exceptional $119,094 |
| Immigrants | Belgium | 100.0 /100 | #22 | Exceptional $118,932 |
| Bolivians | 100.0 /100 | #23 | Exceptional $118,871 |
| Immigrants | Japan | 100.0 /100 | #24 | Exceptional $118,498 |
| Asians | 100.0 /100 | #25 | Exceptional $118,426 |
| Immigrants | Sweden | 100.0 /100 | #26 | Exceptional $118,318 |
Demographics Similar to Italians by Householder Income Ages 45 - 64 years
In terms of householder income ages 45 - 64 years, the demographic groups most similar to Italians are Assyrian/Chaldean/Syriac ($110,201, a difference of 0.020%), Korean ($110,334, a difference of 0.10%), Argentinean ($110,103, a difference of 0.11%), Immigrants from Italy ($110,434, a difference of 0.19%), and Immigrants from Egypt ($109,941, a difference of 0.26%).
| Demographics | Rating | Rank | Householder Income Ages 45 - 64 years |
| Immigrants | Latvia | 99.6 /100 | #64 | Exceptional $111,454 |
| Immigrants | Belarus | 99.6 /100 | #65 | Exceptional $111,430 |
| New Zealanders | 99.6 /100 | #66 | Exceptional $111,286 |
| Laotians | 99.5 /100 | #67 | Exceptional $111,051 |
| Immigrants | Romania | 99.4 /100 | #68 | Exceptional $110,633 |
| Immigrants | Italy | 99.4 /100 | #69 | Exceptional $110,434 |
| Koreans | 99.3 /100 | #70 | Exceptional $110,334 |
| Italians | 99.3 /100 | #71 | Exceptional $110,224 |
| Assyrians/Chaldeans/Syriacs | 99.3 /100 | #72 | Exceptional $110,201 |
| Argentineans | 99.3 /100 | #73 | Exceptional $110,103 |
| Immigrants | Egypt | 99.2 /100 | #74 | Exceptional $109,941 |
| South Africans | 99.1 /100 | #75 | Exceptional $109,719 |
| Paraguayans | 99.0 /100 | #76 | Exceptional $109,447 |
| Immigrants | England | 99.0 /100 | #77 | Exceptional $109,446 |
| Immigrants | Canada | 99.0 /100 | #78 | Exceptional $109,402 |