Alaskan Athabascan vs Cheyenne Householder Income Over 65 years
COMPARE
Alaskan Athabascan
Cheyenne
Householder Income Over 65 years
Householder Income Over 65 years Comparison
Alaskan Athabascans
Cheyenne
$62,330
HOUSEHOLDER INCOME OVER 65 YEARS
80.6/ 100
METRIC RATING
136th/ 347
METRIC RANK
$54,096
HOUSEHOLDER INCOME OVER 65 YEARS
0.1/ 100
METRIC RATING
277th/ 347
METRIC RANK
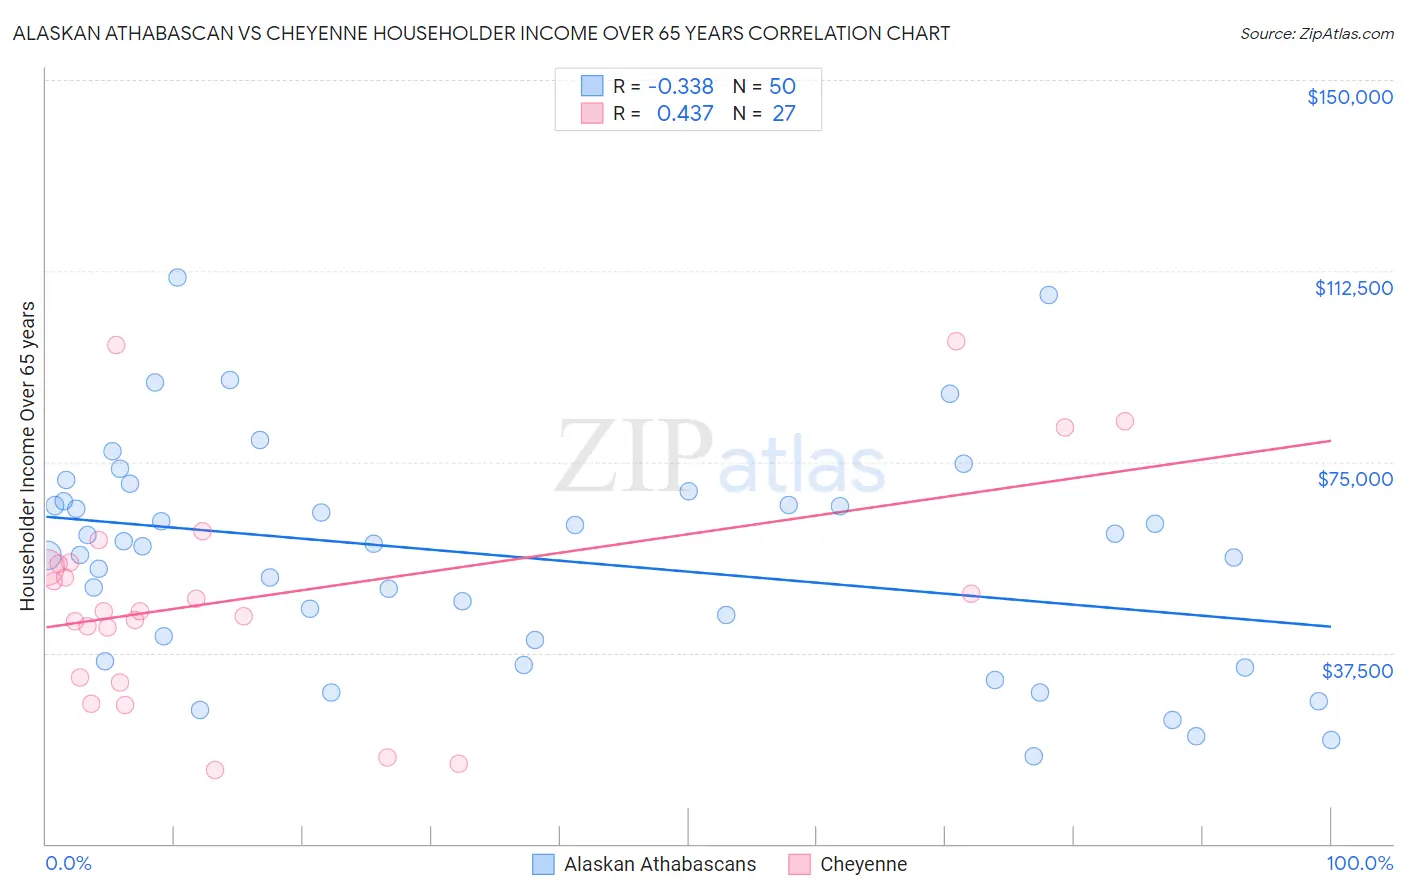
Alaskan Athabascan vs Cheyenne Householder Income Over 65 years Correlation Chart
The statistical analysis conducted on geographies consisting of 45,769,893 people shows a mild negative correlation between the proportion of Alaskan Athabascans and household income with householder over the age of 65 in the United States with a correlation coefficient (R) of -0.338 and weighted average of $62,330. Similarly, the statistical analysis conducted on geographies consisting of 80,656,378 people shows a moderate positive correlation between the proportion of Cheyenne and household income with householder over the age of 65 in the United States with a correlation coefficient (R) of 0.437 and weighted average of $54,096, a difference of 15.2%.
Householder Income Over 65 years Correlation Summary
| Measurement | Alaskan Athabascan | Cheyenne |
| Minimum | $17,188 | $14,422 |
| Maximum | $111,125 | $98,750 |
| Range | $93,937 | $84,328 |
| Mean | $56,372 | $48,996 |
| Median | $58,696 | $45,764 |
| Interquartile 25% (IQ1) | $40,000 | $32,697 |
| Interquartile 75% (IQ3) | $67,202 | $55,318 |
| Interquartile Range (IQR) | $27,202 | $22,620 |
| Standard Deviation (Sample) | $21,725 | $21,930 |
| Standard Deviation (Population) | $21,506 | $21,520 |
Similar Demographics by Householder Income Over 65 years
Demographics Similar to Alaskan Athabascans by Householder Income Over 65 years
In terms of householder income over 65 years, the demographic groups most similar to Alaskan Athabascans are Immigrants from Chile ($62,354, a difference of 0.040%), Immigrants from Syria ($62,303, a difference of 0.040%), Immigrants from Brazil ($62,364, a difference of 0.060%), Immigrants from Kazakhstan ($62,292, a difference of 0.060%), and Lebanese ($62,287, a difference of 0.070%).
| Demographics | Rating | Rank | Householder Income Over 65 years |
| Immigrants | Eastern Europe | 85.9 /100 | #129 | Excellent $62,693 |
| Basques | 85.4 /100 | #130 | Excellent $62,653 |
| Immigrants | Western Asia | 85.3 /100 | #131 | Excellent $62,645 |
| Immigrants | Germany | 83.9 /100 | #132 | Excellent $62,544 |
| Immigrants | Northern Africa | 83.6 /100 | #133 | Excellent $62,522 |
| Immigrants | Brazil | 81.2 /100 | #134 | Excellent $62,364 |
| Immigrants | Chile | 81.0 /100 | #135 | Excellent $62,354 |
| Alaskan Athabascans | 80.6 /100 | #136 | Excellent $62,330 |
| Immigrants | Syria | 80.2 /100 | #137 | Excellent $62,303 |
| Immigrants | Kazakhstan | 80.0 /100 | #138 | Excellent $62,292 |
| Lebanese | 79.9 /100 | #139 | Good $62,287 |
| Arabs | 79.6 /100 | #140 | Good $62,266 |
| Canadians | 79.0 /100 | #141 | Good $62,230 |
| South American Indians | 78.7 /100 | #142 | Good $62,215 |
| Immigrants | Belarus | 77.8 /100 | #143 | Good $62,162 |
Demographics Similar to Cheyenne by Householder Income Over 65 years
In terms of householder income over 65 years, the demographic groups most similar to Cheyenne are Cree ($54,129, a difference of 0.060%), Cherokee ($54,133, a difference of 0.070%), Barbadian ($54,163, a difference of 0.12%), Immigrants from Ecuador ($54,030, a difference of 0.12%), and Blackfeet ($54,029, a difference of 0.12%).
| Demographics | Rating | Rank | Householder Income Over 65 years |
| Immigrants | Senegal | 0.1 /100 | #270 | Tragic $54,447 |
| Liberians | 0.1 /100 | #271 | Tragic $54,356 |
| Potawatomi | 0.1 /100 | #272 | Tragic $54,212 |
| Indonesians | 0.1 /100 | #273 | Tragic $54,176 |
| Barbadians | 0.1 /100 | #274 | Tragic $54,163 |
| Cherokee | 0.1 /100 | #275 | Tragic $54,133 |
| Cree | 0.1 /100 | #276 | Tragic $54,129 |
| Cheyenne | 0.1 /100 | #277 | Tragic $54,096 |
| Immigrants | Ecuador | 0.1 /100 | #278 | Tragic $54,030 |
| Blackfeet | 0.1 /100 | #279 | Tragic $54,029 |
| Immigrants | Jamaica | 0.1 /100 | #280 | Tragic $54,027 |
| Somalis | 0.1 /100 | #281 | Tragic $54,004 |
| Immigrants | Armenia | 0.1 /100 | #282 | Tragic $53,974 |
| Immigrants | Liberia | 0.1 /100 | #283 | Tragic $53,967 |
| Immigrants | Guatemala | 0.1 /100 | #284 | Tragic $53,950 |