Chinese vs Immigrants from Kazakhstan Per Capita Income
COMPARE
Chinese
Immigrants from Kazakhstan
Per Capita Income
Per Capita Income Comparison
Chinese
Immigrants from Kazakhstan
$46,098
PER CAPITA INCOME
93.9/ 100
METRIC RATING
117th/ 347
METRIC RANK
$48,747
PER CAPITA INCOME
99.7/ 100
METRIC RATING
77th/ 347
METRIC RANK
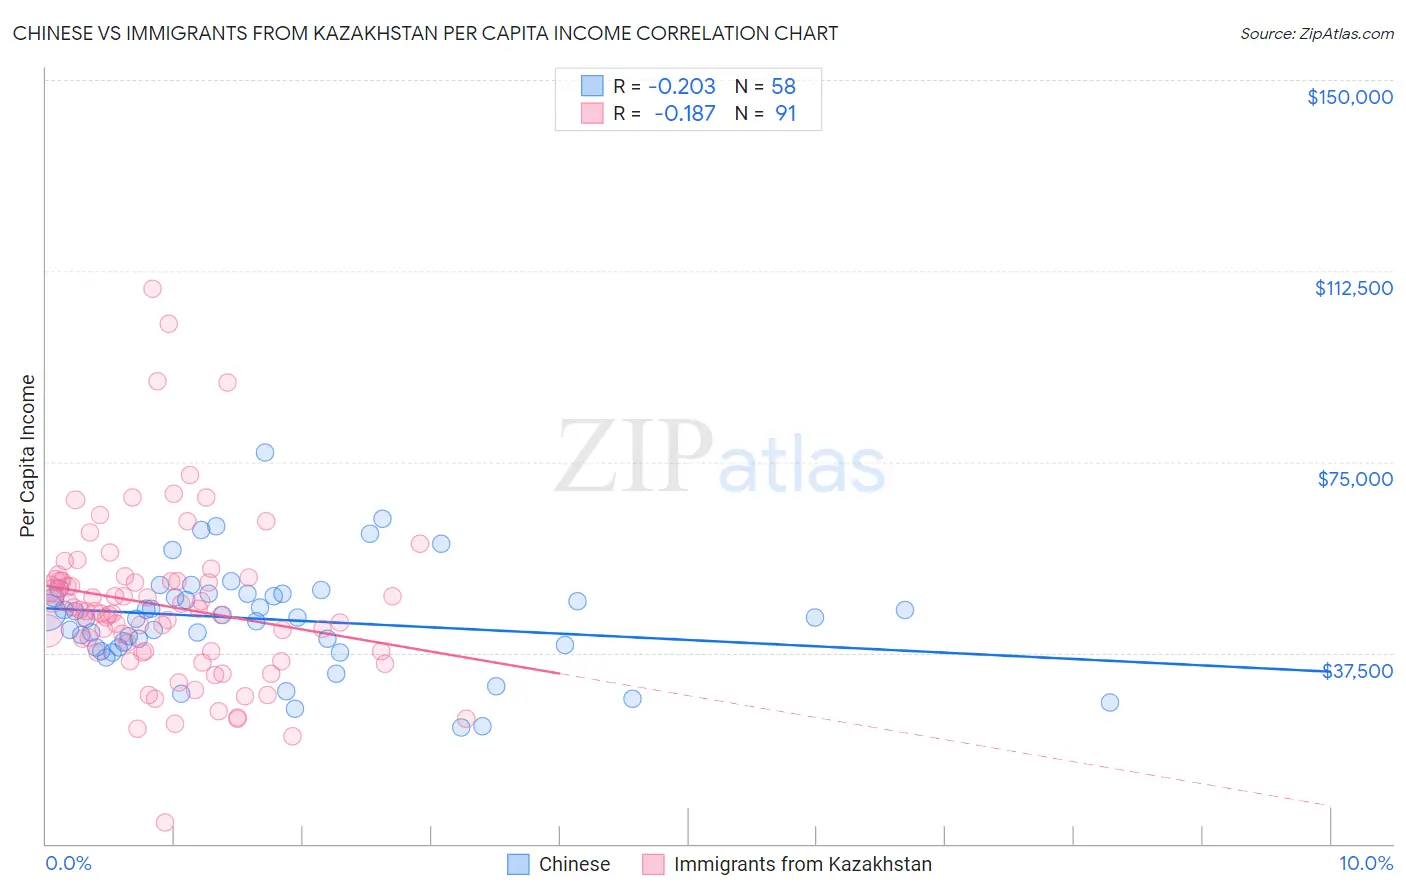
Chinese vs Immigrants from Kazakhstan Per Capita Income Correlation Chart
The statistical analysis conducted on geographies consisting of 64,809,125 people shows a weak negative correlation between the proportion of Chinese and per capita income in the United States with a correlation coefficient (R) of -0.203 and weighted average of $46,098. Similarly, the statistical analysis conducted on geographies consisting of 124,442,915 people shows a poor negative correlation between the proportion of Immigrants from Kazakhstan and per capita income in the United States with a correlation coefficient (R) of -0.187 and weighted average of $48,747, a difference of 5.8%.
Per Capita Income Correlation Summary
| Measurement | Chinese | Immigrants from Kazakhstan |
| Minimum | $22,765 | $4,252 |
| Maximum | $76,789 | $109,103 |
| Range | $54,024 | $104,851 |
| Mean | $44,105 | $46,679 |
| Median | $44,514 | $45,620 |
| Interquartile 25% (IQ1) | $38,432 | $37,540 |
| Interquartile 75% (IQ3) | $49,089 | $51,665 |
| Interquartile Range (IQR) | $10,657 | $14,125 |
| Standard Deviation (Sample) | $10,226 | $16,400 |
| Standard Deviation (Population) | $10,137 | $16,310 |
Similar Demographics by Per Capita Income
Demographics Similar to Chinese by Per Capita Income
In terms of per capita income, the demographic groups most similar to Chinese are Polish ($46,123, a difference of 0.050%), Immigrants from Saudi Arabia ($46,008, a difference of 0.19%), Immigrants from Chile ($46,213, a difference of 0.25%), Immigrants from Poland ($45,979, a difference of 0.26%), and Afghan ($46,268, a difference of 0.37%).
| Demographics | Rating | Rank | Per Capita Income |
| Chileans | 95.9 /100 | #110 | Exceptional $46,459 |
| Taiwanese | 95.8 /100 | #111 | Exceptional $46,455 |
| Immigrants | Morocco | 95.7 /100 | #112 | Exceptional $46,430 |
| Immigrants | Albania | 95.5 /100 | #113 | Exceptional $46,387 |
| Afghans | 94.9 /100 | #114 | Exceptional $46,268 |
| Immigrants | Chile | 94.6 /100 | #115 | Exceptional $46,213 |
| Poles | 94.1 /100 | #116 | Exceptional $46,123 |
| Chinese | 93.9 /100 | #117 | Exceptional $46,098 |
| Immigrants | Saudi Arabia | 93.3 /100 | #118 | Exceptional $46,008 |
| Immigrants | Poland | 93.1 /100 | #119 | Exceptional $45,979 |
| Immigrants | Ethiopia | 92.7 /100 | #120 | Exceptional $45,923 |
| Canadians | 92.2 /100 | #121 | Exceptional $45,858 |
| Moroccans | 92.1 /100 | #122 | Exceptional $45,854 |
| Lebanese | 92.0 /100 | #123 | Exceptional $45,840 |
| Europeans | 92.0 /100 | #124 | Exceptional $45,836 |
Demographics Similar to Immigrants from Kazakhstan by Per Capita Income
In terms of per capita income, the demographic groups most similar to Immigrants from Kazakhstan are Immigrants from Italy ($48,654, a difference of 0.19%), Immigrants from England ($48,844, a difference of 0.20%), Immigrants from Bolivia ($48,970, a difference of 0.46%), Romanian ($48,445, a difference of 0.62%), and Egyptian ($48,358, a difference of 0.80%).
| Demographics | Rating | Rank | Per Capita Income |
| Immigrants | Eastern Europe | 99.8 /100 | #70 | Exceptional $49,316 |
| Greeks | 99.8 /100 | #71 | Exceptional $49,309 |
| Immigrants | Hungary | 99.8 /100 | #72 | Exceptional $49,303 |
| Immigrants | North America | 99.8 /100 | #73 | Exceptional $49,302 |
| Mongolians | 99.8 /100 | #74 | Exceptional $49,173 |
| Immigrants | Bolivia | 99.7 /100 | #75 | Exceptional $48,970 |
| Immigrants | England | 99.7 /100 | #76 | Exceptional $48,844 |
| Immigrants | Kazakhstan | 99.7 /100 | #77 | Exceptional $48,747 |
| Immigrants | Italy | 99.6 /100 | #78 | Exceptional $48,654 |
| Romanians | 99.5 /100 | #79 | Exceptional $48,445 |
| Egyptians | 99.5 /100 | #80 | Exceptional $48,358 |
| Armenians | 99.4 /100 | #81 | Exceptional $48,287 |
| Immigrants | Indonesia | 99.4 /100 | #82 | Exceptional $48,195 |
| Immigrants | Brazil | 99.4 /100 | #83 | Exceptional $48,164 |
| Immigrants | Ukraine | 99.3 /100 | #84 | Exceptional $48,134 |