Chilean vs Cree Unemployment Among Women with Children Under 18 years
COMPARE
Chilean
Cree
Unemployment Among Women with Children Under 18 years
Unemployment Among Women with Children Under 18 years Comparison
Chileans
Cree
5.3%
UNEMPLOYMENT AMONG WOMEN WITH CHILDREN UNDER 18 YEARS
75.0/ 100
METRIC RATING
143rd/ 347
METRIC RANK
6.3%
UNEMPLOYMENT AMONG WOMEN WITH CHILDREN UNDER 18 YEARS
0.0/ 100
METRIC RATING
288th/ 347
METRIC RANK
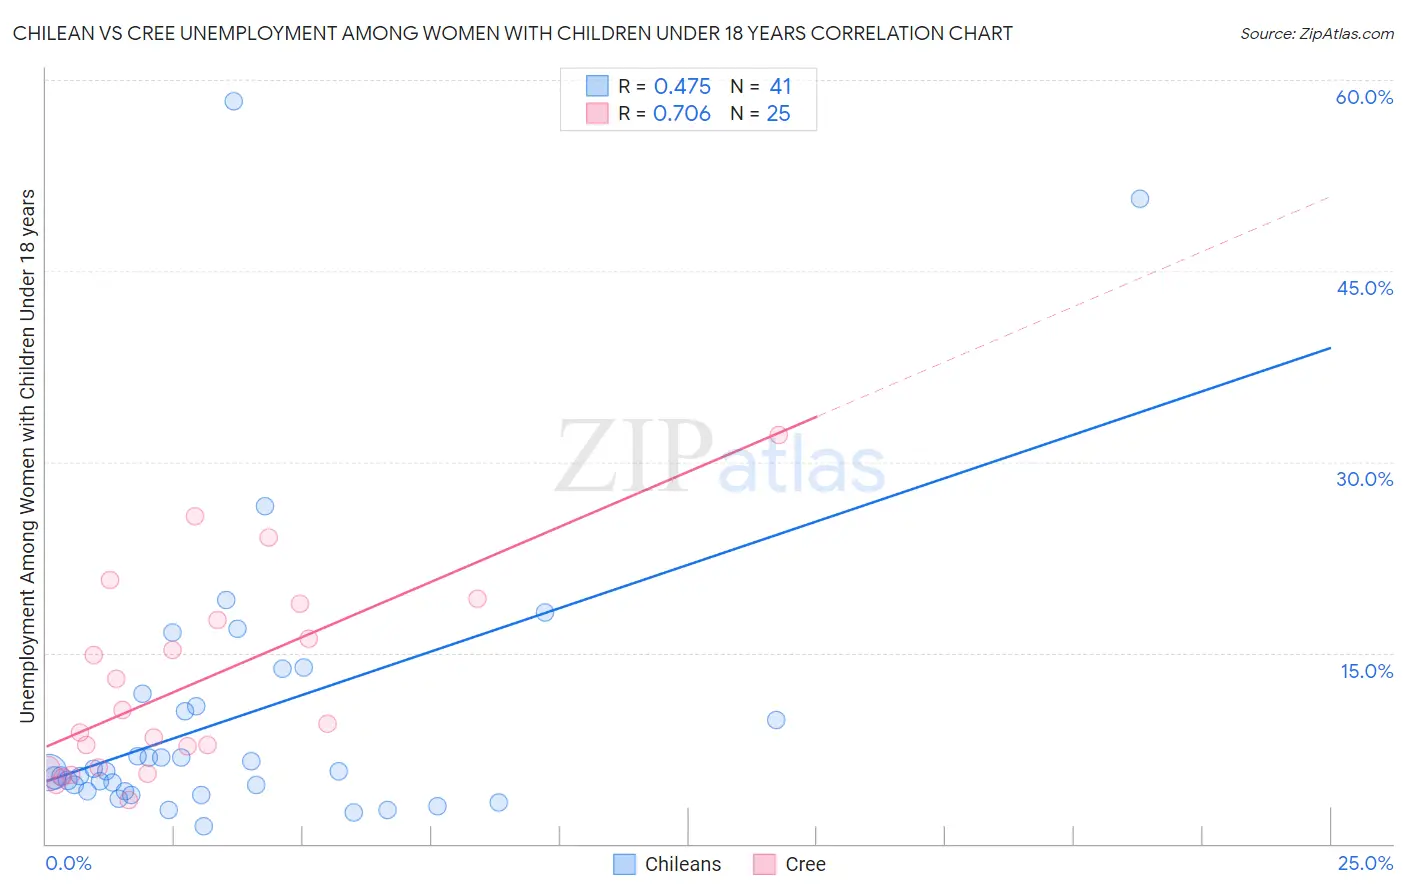
Chilean vs Cree Unemployment Among Women with Children Under 18 years Correlation Chart
The statistical analysis conducted on geographies consisting of 251,508,353 people shows a moderate positive correlation between the proportion of Chileans and unemployment rate among women with children under the age of 18 in the United States with a correlation coefficient (R) of 0.475 and weighted average of 5.3%. Similarly, the statistical analysis conducted on geographies consisting of 75,145,455 people shows a strong positive correlation between the proportion of Cree and unemployment rate among women with children under the age of 18 in the United States with a correlation coefficient (R) of 0.706 and weighted average of 6.3%, a difference of 18.7%.
Unemployment Among Women with Children Under 18 years Correlation Summary
| Measurement | Chilean | Cree |
| Minimum | 1.4% | 3.4% |
| Maximum | 58.3% | 32.1% |
| Range | 56.9% | 28.7% |
| Mean | 10.0% | 12.6% |
| Median | 5.7% | 9.4% |
| Interquartile 25% (IQ1) | 4.2% | 5.9% |
| Interquartile 75% (IQ3) | 11.3% | 18.2% |
| Interquartile Range (IQR) | 7.1% | 12.3% |
| Standard Deviation (Sample) | 11.6% | 7.6% |
| Standard Deviation (Population) | 11.5% | 7.5% |
Similar Demographics by Unemployment Among Women with Children Under 18 years
Demographics Similar to Chileans by Unemployment Among Women with Children Under 18 years
In terms of unemployment among women with children under 18 years, the demographic groups most similar to Chileans are Immigrants from England (5.3%, a difference of 0.010%), Immigrants from Venezuela (5.3%, a difference of 0.040%), Venezuelan (5.3%, a difference of 0.10%), Immigrants from Egypt (5.3%, a difference of 0.10%), and Immigrants from Norway (5.3%, a difference of 0.12%).
| Demographics | Rating | Rank | Unemployment Among Women with Children Under 18 years |
| Immigrants | Jordan | 79.5 /100 | #136 | Good 5.3% |
| Jordanians | 78.8 /100 | #137 | Good 5.3% |
| Argentineans | 78.8 /100 | #138 | Good 5.3% |
| Immigrants | Ukraine | 78.5 /100 | #139 | Good 5.3% |
| Immigrants | Norway | 76.2 /100 | #140 | Good 5.3% |
| Venezuelans | 76.0 /100 | #141 | Good 5.3% |
| Immigrants | Venezuela | 75.4 /100 | #142 | Good 5.3% |
| Chileans | 75.0 /100 | #143 | Good 5.3% |
| Immigrants | England | 74.9 /100 | #144 | Good 5.3% |
| Immigrants | Egypt | 74.0 /100 | #145 | Good 5.3% |
| Immigrants | Belarus | 73.4 /100 | #146 | Good 5.3% |
| Bangladeshis | 73.2 /100 | #147 | Good 5.3% |
| Immigrants | Western Europe | 72.8 /100 | #148 | Good 5.4% |
| Immigrants | Kenya | 72.2 /100 | #149 | Good 5.4% |
| Immigrants | Argentina | 71.7 /100 | #150 | Good 5.4% |
Demographics Similar to Cree by Unemployment Among Women with Children Under 18 years
In terms of unemployment among women with children under 18 years, the demographic groups most similar to Cree are Kiowa (6.3%, a difference of 0.12%), Alaskan Athabascan (6.3%, a difference of 0.13%), Bahamian (6.3%, a difference of 0.28%), Immigrants from Caribbean (6.4%, a difference of 0.36%), and Blackfeet (6.4%, a difference of 0.40%).
| Demographics | Rating | Rank | Unemployment Among Women with Children Under 18 years |
| Immigrants | El Salvador | 0.0 /100 | #281 | Tragic 6.3% |
| Immigrants | St. Vincent and the Grenadines | 0.0 /100 | #282 | Tragic 6.3% |
| West Indians | 0.0 /100 | #283 | Tragic 6.3% |
| Immigrants | Grenada | 0.0 /100 | #284 | Tragic 6.3% |
| Bahamians | 0.0 /100 | #285 | Tragic 6.3% |
| Alaskan Athabascans | 0.0 /100 | #286 | Tragic 6.3% |
| Kiowa | 0.0 /100 | #287 | Tragic 6.3% |
| Cree | 0.0 /100 | #288 | Tragic 6.3% |
| Immigrants | Caribbean | 0.0 /100 | #289 | Tragic 6.4% |
| Blackfeet | 0.0 /100 | #290 | Tragic 6.4% |
| Immigrants | Guatemala | 0.0 /100 | #291 | Tragic 6.4% |
| Mexicans | 0.0 /100 | #292 | Tragic 6.4% |
| Immigrants | Bangladesh | 0.0 /100 | #293 | Tragic 6.4% |
| Hondurans | 0.0 /100 | #294 | Tragic 6.4% |
| Barbadians | 0.0 /100 | #295 | Tragic 6.4% |