Immigrants from Europe vs Immigrants from Spain Median Male Earnings
COMPARE
Immigrants from Europe
Immigrants from Spain
Median Male Earnings
Median Male Earnings Comparison
Immigrants from Europe
Immigrants from Spain
$62,057
MEDIAN MALE EARNINGS
99.9/ 100
METRIC RATING
49th/ 347
METRIC RANK
$60,750
MEDIAN MALE EARNINGS
99.8/ 100
METRIC RATING
67th/ 347
METRIC RANK
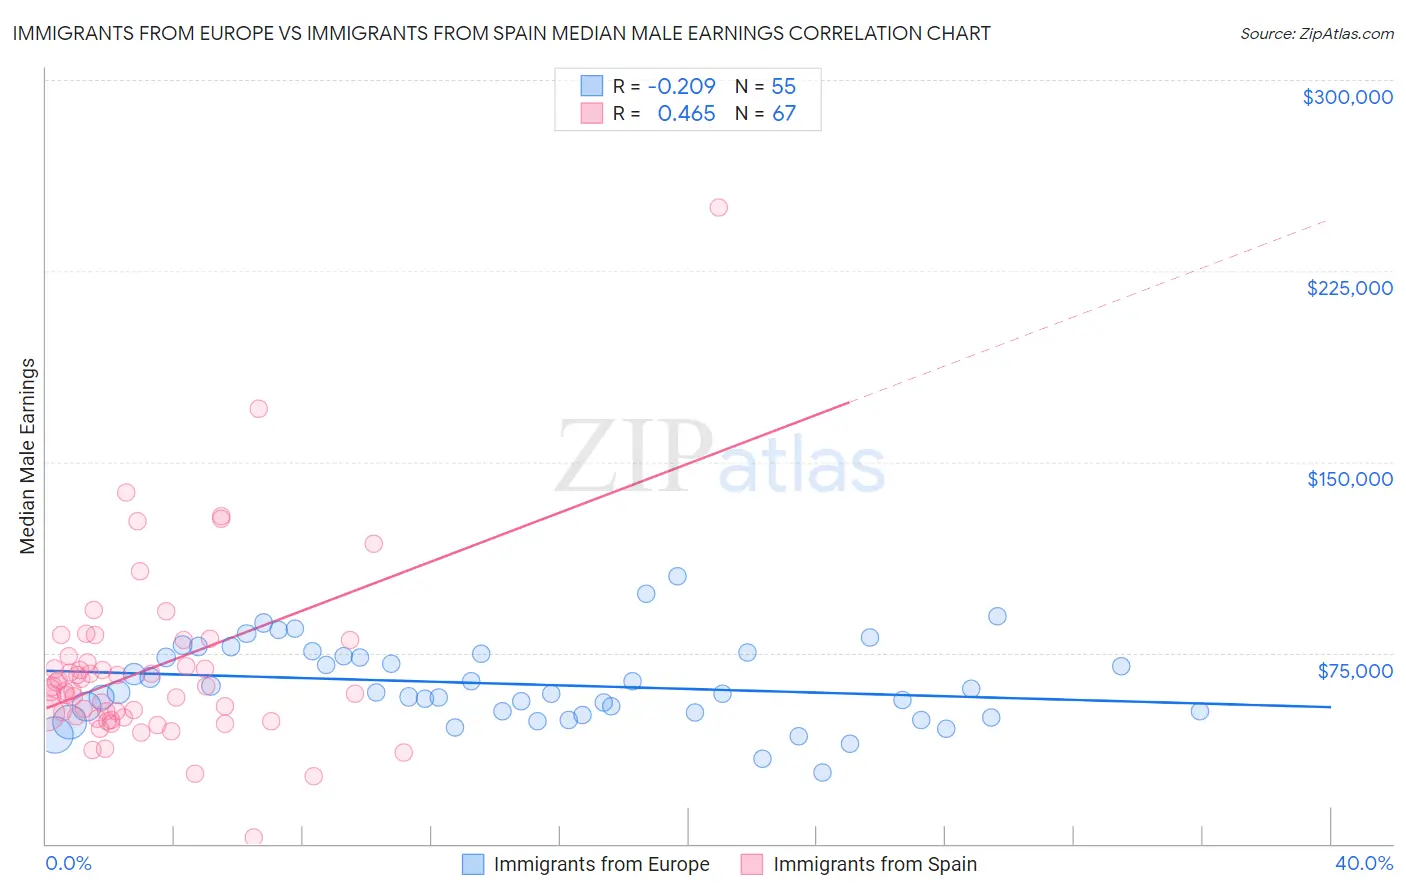
Immigrants from Europe vs Immigrants from Spain Median Male Earnings Correlation Chart
The statistical analysis conducted on geographies consisting of 546,673,847 people shows a weak negative correlation between the proportion of Immigrants from Europe and median male earnings in the United States with a correlation coefficient (R) of -0.209 and weighted average of $62,057. Similarly, the statistical analysis conducted on geographies consisting of 239,649,237 people shows a moderate positive correlation between the proportion of Immigrants from Spain and median male earnings in the United States with a correlation coefficient (R) of 0.465 and weighted average of $60,750, a difference of 2.1%.
Median Male Earnings Correlation Summary
| Measurement | Immigrants from Europe | Immigrants from Spain |
| Minimum | $28,125 | $2,499 |
| Maximum | $105,302 | $250,001 |
| Range | $77,177 | $247,502 |
| Mean | $62,740 | $68,720 |
| Median | $59,324 | $60,260 |
| Interquartile 25% (IQ1) | $51,620 | $49,576 |
| Interquartile 75% (IQ3) | $74,675 | $73,651 |
| Interquartile Range (IQR) | $23,055 | $24,075 |
| Standard Deviation (Sample) | $15,923 | $35,640 |
| Standard Deviation (Population) | $15,777 | $35,373 |
Demographics Similar to Immigrants from Europe and Immigrants from Spain by Median Male Earnings
In terms of median male earnings, the demographic groups most similar to Immigrants from Europe are Immigrants from Malaysia ($62,121, a difference of 0.10%), Bhutanese ($61,759, a difference of 0.48%), Estonian ($61,710, a difference of 0.56%), Immigrants from Norway ($61,628, a difference of 0.70%), and South African ($61,460, a difference of 0.97%). Similarly, the demographic groups most similar to Immigrants from Spain are Immigrants from Serbia ($60,600, a difference of 0.25%), Immigrants from Croatia ($60,914, a difference of 0.27%), Immigrants from Indonesia ($60,935, a difference of 0.30%), Immigrants from Eastern Europe ($60,958, a difference of 0.34%), and Immigrants from Pakistan ($60,987, a difference of 0.39%).
| Demographics | Rating | Rank | Median Male Earnings |
| Immigrants | Malaysia | 99.9 /100 | #48 | Exceptional $62,121 |
| Immigrants | Europe | 99.9 /100 | #49 | Exceptional $62,057 |
| Bhutanese | 99.9 /100 | #50 | Exceptional $61,759 |
| Estonians | 99.9 /100 | #51 | Exceptional $61,710 |
| Immigrants | Norway | 99.9 /100 | #52 | Exceptional $61,628 |
| South Africans | 99.9 /100 | #53 | Exceptional $61,460 |
| Immigrants | Latvia | 99.9 /100 | #54 | Exceptional $61,422 |
| Greeks | 99.9 /100 | #55 | Exceptional $61,242 |
| Lithuanians | 99.9 /100 | #56 | Exceptional $61,228 |
| Immigrants | Scotland | 99.9 /100 | #57 | Exceptional $61,220 |
| New Zealanders | 99.9 /100 | #58 | Exceptional $61,199 |
| Immigrants | Netherlands | 99.8 /100 | #59 | Exceptional $61,096 |
| Egyptians | 99.8 /100 | #60 | Exceptional $61,095 |
| Bolivians | 99.8 /100 | #61 | Exceptional $61,066 |
| Immigrants | Romania | 99.8 /100 | #62 | Exceptional $61,040 |
| Immigrants | Pakistan | 99.8 /100 | #63 | Exceptional $60,987 |
| Immigrants | Eastern Europe | 99.8 /100 | #64 | Exceptional $60,958 |
| Immigrants | Indonesia | 99.8 /100 | #65 | Exceptional $60,935 |
| Immigrants | Croatia | 99.8 /100 | #66 | Exceptional $60,914 |
| Immigrants | Spain | 99.8 /100 | #67 | Exceptional $60,750 |
| Immigrants | Serbia | 99.7 /100 | #68 | Exceptional $60,600 |