Cherokee vs Puerto Rican Per Capita Income
COMPARE
Cherokee
Puerto Rican
Per Capita Income
Per Capita Income Comparison
Cherokee
Puerto Ricans
$37,203
PER CAPITA INCOME
0.1/ 100
METRIC RATING
299th/ 347
METRIC RANK
$31,268
PER CAPITA INCOME
0.0/ 100
METRIC RATING
341st/ 347
METRIC RANK
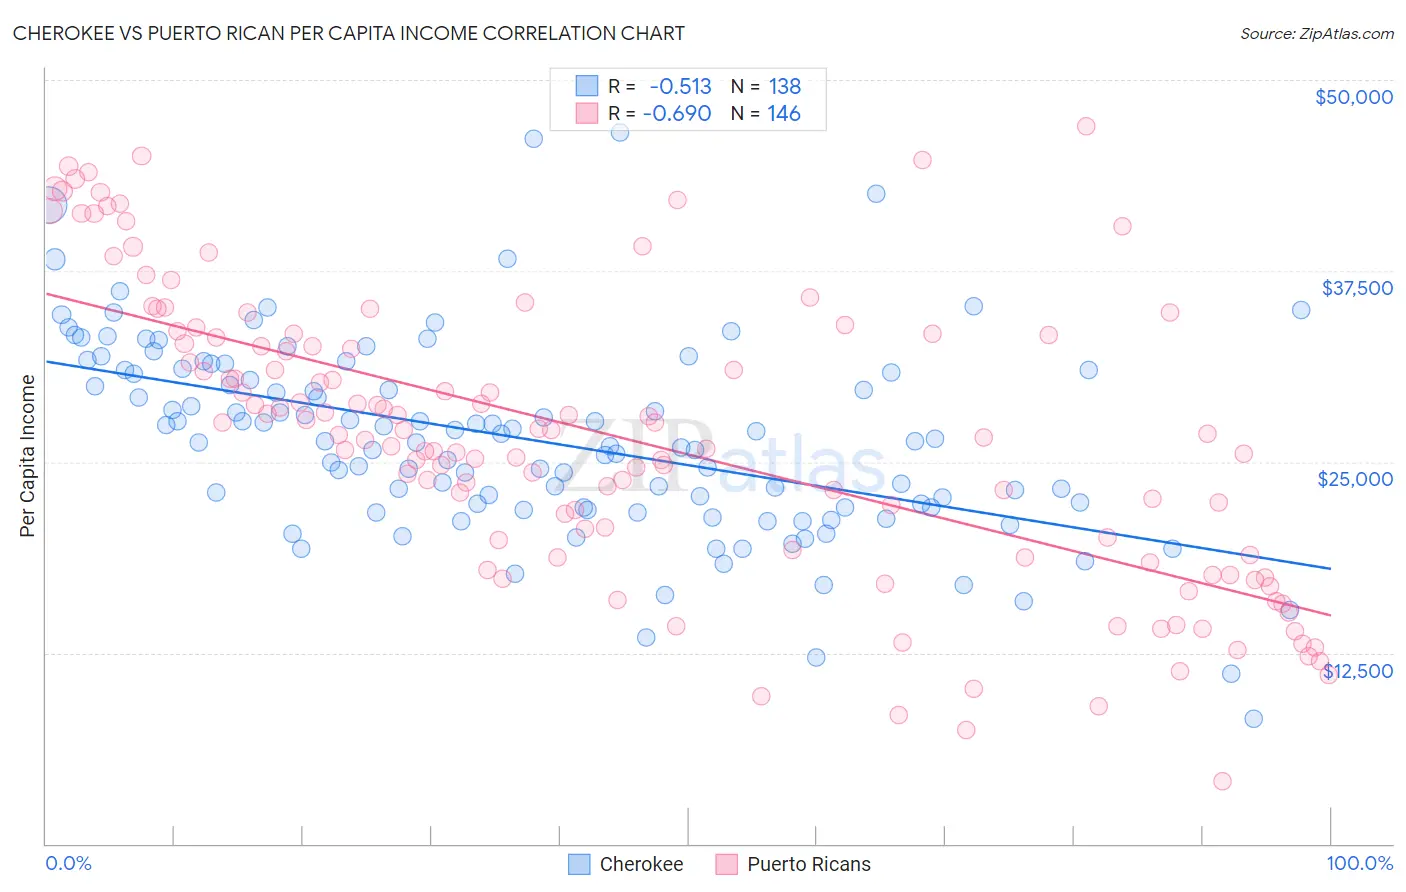
Cherokee vs Puerto Rican Per Capita Income Correlation Chart
The statistical analysis conducted on geographies consisting of 493,739,592 people shows a substantial negative correlation between the proportion of Cherokee and per capita income in the United States with a correlation coefficient (R) of -0.513 and weighted average of $37,203. Similarly, the statistical analysis conducted on geographies consisting of 528,362,553 people shows a significant negative correlation between the proportion of Puerto Ricans and per capita income in the United States with a correlation coefficient (R) of -0.690 and weighted average of $31,268, a difference of 19.0%.
Per Capita Income Correlation Summary
| Measurement | Cherokee | Puerto Rican |
| Minimum | $8,186 | $4,085 |
| Maximum | $46,594 | $46,990 |
| Range | $38,408 | $42,905 |
| Mean | $26,478 | $26,618 |
| Median | $26,343 | $26,784 |
| Interquartile 25% (IQ1) | $21,995 | $18,902 |
| Interquartile 75% (IQ3) | $30,981 | $33,347 |
| Interquartile Range (IQR) | $8,986 | $14,444 |
| Standard Deviation (Sample) | $6,463 | $9,544 |
| Standard Deviation (Population) | $6,439 | $9,511 |
Similar Demographics by Per Capita Income
Demographics Similar to Cherokee by Per Capita Income
In terms of per capita income, the demographic groups most similar to Cherokee are Immigrants from Bahamas ($37,193, a difference of 0.030%), Immigrants from Caribbean ($37,254, a difference of 0.14%), Haitian ($37,289, a difference of 0.23%), Indonesian ($37,300, a difference of 0.26%), and Immigrants from Dominican Republic ($37,306, a difference of 0.27%).
| Demographics | Rating | Rank | Per Capita Income |
| Immigrants | Micronesia | 0.1 /100 | #292 | Tragic $37,464 |
| Mexican American Indians | 0.1 /100 | #293 | Tragic $37,407 |
| Cubans | 0.1 /100 | #294 | Tragic $37,383 |
| Immigrants | Dominican Republic | 0.1 /100 | #295 | Tragic $37,306 |
| Indonesians | 0.1 /100 | #296 | Tragic $37,300 |
| Haitians | 0.1 /100 | #297 | Tragic $37,289 |
| Immigrants | Caribbean | 0.1 /100 | #298 | Tragic $37,254 |
| Cherokee | 0.1 /100 | #299 | Tragic $37,203 |
| Immigrants | Bahamas | 0.1 /100 | #300 | Tragic $37,193 |
| Ottawa | 0.1 /100 | #301 | Tragic $37,101 |
| Shoshone | 0.1 /100 | #302 | Tragic $37,072 |
| Paiute | 0.1 /100 | #303 | Tragic $37,066 |
| Hondurans | 0.1 /100 | #304 | Tragic $37,031 |
| Inupiat | 0.1 /100 | #305 | Tragic $36,999 |
| Immigrants | Haiti | 0.0 /100 | #306 | Tragic $36,849 |
Demographics Similar to Puerto Ricans by Per Capita Income
In terms of per capita income, the demographic groups most similar to Puerto Ricans are Hopi ($31,177, a difference of 0.29%), Crow ($31,729, a difference of 1.5%), Pima ($30,644, a difference of 2.0%), Pueblo ($32,012, a difference of 2.4%), and Yup'ik ($30,518, a difference of 2.5%).
| Demographics | Rating | Rank | Per Capita Income |
| Immigrants | Yemen | 0.0 /100 | #333 | Tragic $33,696 |
| Natives/Alaskans | 0.0 /100 | #334 | Tragic $33,279 |
| Yuman | 0.0 /100 | #335 | Tragic $33,236 |
| Yakama | 0.0 /100 | #336 | Tragic $33,009 |
| Houma | 0.0 /100 | #337 | Tragic $32,996 |
| Arapaho | 0.0 /100 | #338 | Tragic $32,345 |
| Pueblo | 0.0 /100 | #339 | Tragic $32,012 |
| Crow | 0.0 /100 | #340 | Tragic $31,729 |
| Puerto Ricans | 0.0 /100 | #341 | Tragic $31,268 |
| Hopi | 0.0 /100 | #342 | Tragic $31,177 |
| Pima | 0.0 /100 | #343 | Tragic $30,644 |
| Yup'ik | 0.0 /100 | #344 | Tragic $30,518 |
| Tohono O'odham | 0.0 /100 | #345 | Tragic $30,256 |
| Lumbee | 0.0 /100 | #346 | Tragic $29,845 |
| Navajo | 0.0 /100 | #347 | Tragic $29,031 |