Argentinean vs Cuban Per Capita Income
COMPARE
Argentinean
Cuban
Per Capita Income
Per Capita Income Comparison
Argentineans
Cubans
$49,862
PER CAPITA INCOME
99.9/ 100
METRIC RATING
61st/ 347
METRIC RANK
$37,383
PER CAPITA INCOME
0.1/ 100
METRIC RATING
294th/ 347
METRIC RANK
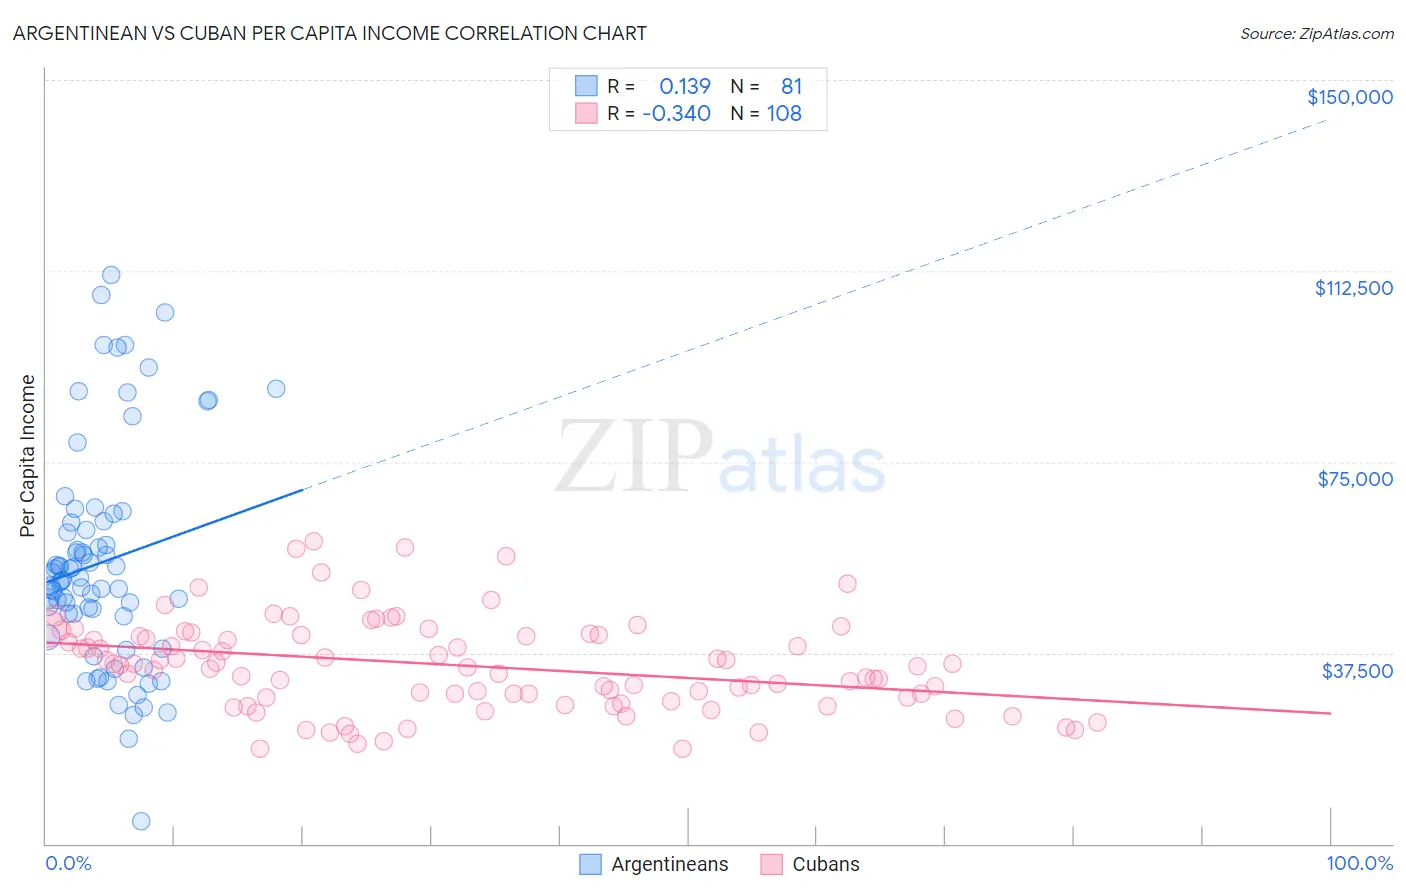
Argentinean vs Cuban Per Capita Income Correlation Chart
The statistical analysis conducted on geographies consisting of 297,154,403 people shows a poor positive correlation between the proportion of Argentineans and per capita income in the United States with a correlation coefficient (R) of 0.139 and weighted average of $49,862. Similarly, the statistical analysis conducted on geographies consisting of 449,330,794 people shows a mild negative correlation between the proportion of Cubans and per capita income in the United States with a correlation coefficient (R) of -0.340 and weighted average of $37,383, a difference of 33.4%.
Per Capita Income Correlation Summary
| Measurement | Argentinean | Cuban |
| Minimum | $4,418 | $18,566 |
| Maximum | $111,640 | $59,513 |
| Range | $107,222 | $40,947 |
| Mean | $55,287 | $35,073 |
| Median | $51,750 | $35,004 |
| Interquartile 25% (IQ1) | $44,864 | $28,628 |
| Interquartile 75% (IQ3) | $63,214 | $40,960 |
| Interquartile Range (IQR) | $18,350 | $12,332 |
| Standard Deviation (Sample) | $21,524 | $9,056 |
| Standard Deviation (Population) | $21,390 | $9,014 |
Similar Demographics by Per Capita Income
Demographics Similar to Argentineans by Per Capita Income
In terms of per capita income, the demographic groups most similar to Argentineans are Immigrants from Scotland ($49,893, a difference of 0.060%), Bhutanese ($49,894, a difference of 0.070%), Immigrants from Malaysia ($49,983, a difference of 0.24%), Immigrants from Asia ($49,741, a difference of 0.24%), and South African ($50,044, a difference of 0.37%).
| Demographics | Rating | Rank | Per Capita Income |
| Immigrants | Belarus | 99.9 /100 | #54 | Exceptional $50,303 |
| Immigrants | Western Europe | 99.9 /100 | #55 | Exceptional $50,065 |
| Asians | 99.9 /100 | #56 | Exceptional $50,057 |
| South Africans | 99.9 /100 | #57 | Exceptional $50,044 |
| Immigrants | Malaysia | 99.9 /100 | #58 | Exceptional $49,983 |
| Bhutanese | 99.9 /100 | #59 | Exceptional $49,894 |
| Immigrants | Scotland | 99.9 /100 | #60 | Exceptional $49,893 |
| Argentineans | 99.9 /100 | #61 | Exceptional $49,862 |
| Immigrants | Asia | 99.9 /100 | #62 | Exceptional $49,741 |
| Maltese | 99.9 /100 | #63 | Exceptional $49,640 |
| Immigrants | Argentina | 99.9 /100 | #64 | Exceptional $49,627 |
| Bolivians | 99.9 /100 | #65 | Exceptional $49,526 |
| Immigrants | Bulgaria | 99.9 /100 | #66 | Exceptional $49,482 |
| Immigrants | Romania | 99.9 /100 | #67 | Exceptional $49,463 |
| Lithuanians | 99.8 /100 | #68 | Exceptional $49,448 |
Demographics Similar to Cubans by Per Capita Income
In terms of per capita income, the demographic groups most similar to Cubans are Mexican American Indian ($37,407, a difference of 0.070%), Immigrants from Dominican Republic ($37,306, a difference of 0.21%), Immigrants from Micronesia ($37,464, a difference of 0.22%), Indonesian ($37,300, a difference of 0.22%), and Haitian ($37,289, a difference of 0.25%).
| Demographics | Rating | Rank | Per Capita Income |
| Dominicans | 0.1 /100 | #287 | Tragic $37,697 |
| Blackfeet | 0.1 /100 | #288 | Tragic $37,695 |
| U.S. Virgin Islanders | 0.1 /100 | #289 | Tragic $37,589 |
| Immigrants | Guatemala | 0.1 /100 | #290 | Tragic $37,550 |
| Cajuns | 0.1 /100 | #291 | Tragic $37,527 |
| Immigrants | Micronesia | 0.1 /100 | #292 | Tragic $37,464 |
| Mexican American Indians | 0.1 /100 | #293 | Tragic $37,407 |
| Cubans | 0.1 /100 | #294 | Tragic $37,383 |
| Immigrants | Dominican Republic | 0.1 /100 | #295 | Tragic $37,306 |
| Indonesians | 0.1 /100 | #296 | Tragic $37,300 |
| Haitians | 0.1 /100 | #297 | Tragic $37,289 |
| Immigrants | Caribbean | 0.1 /100 | #298 | Tragic $37,254 |
| Cherokee | 0.1 /100 | #299 | Tragic $37,203 |
| Immigrants | Bahamas | 0.1 /100 | #300 | Tragic $37,193 |
| Ottawa | 0.1 /100 | #301 | Tragic $37,101 |