Central American vs Kiowa Median Family Income
COMPARE
Central American
Kiowa
Median Family Income
Median Family Income Comparison
Central Americans
Kiowa
$91,087
MEDIAN FAMILY INCOME
0.3/ 100
METRIC RATING
266th/ 347
METRIC RANK
$80,885
MEDIAN FAMILY INCOME
0.0/ 100
METRIC RATING
333rd/ 347
METRIC RANK
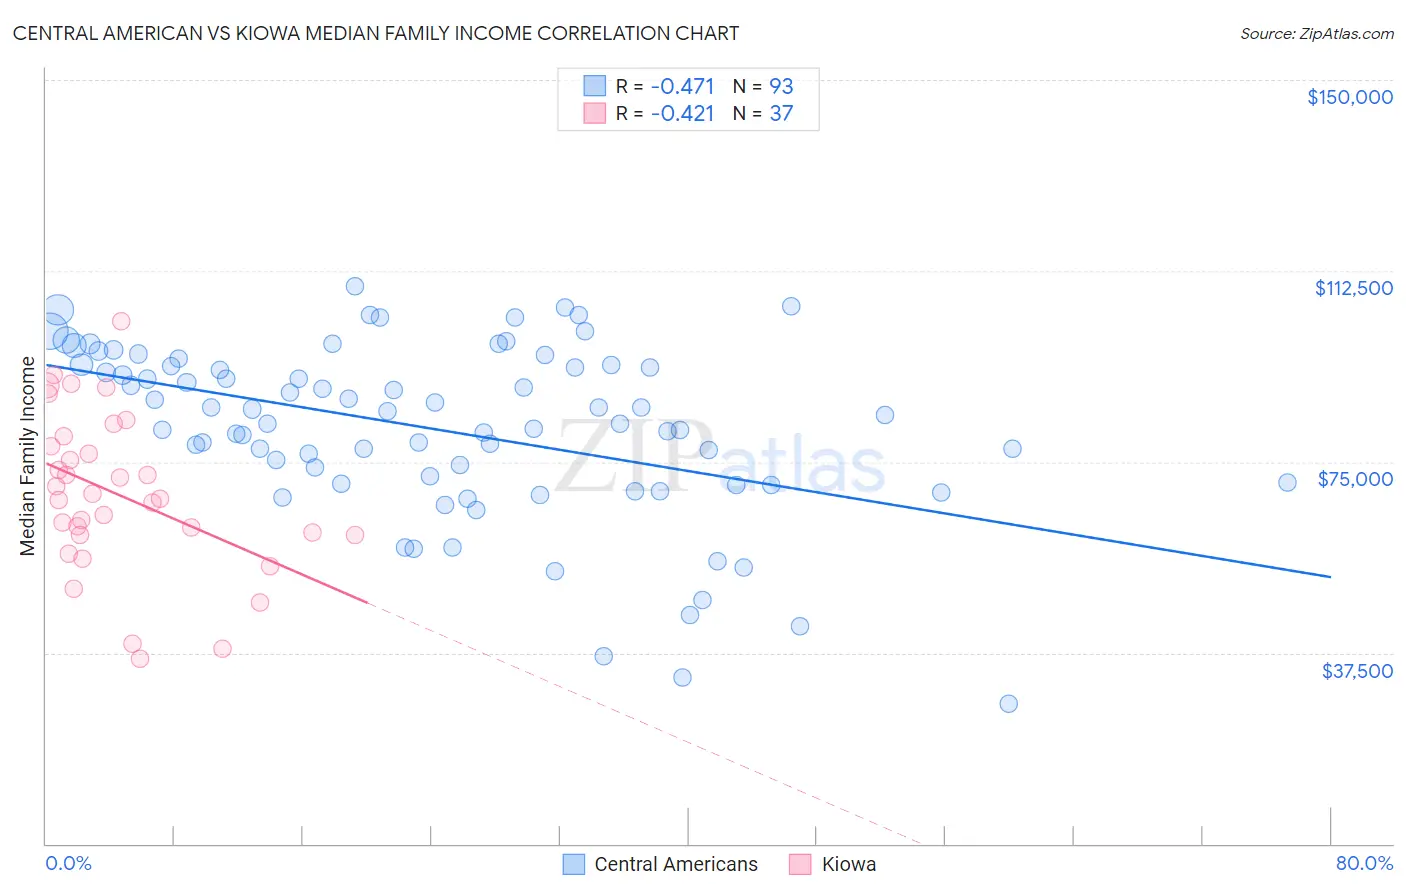
Central American vs Kiowa Median Family Income Correlation Chart
The statistical analysis conducted on geographies consisting of 503,776,524 people shows a moderate negative correlation between the proportion of Central Americans and median family income in the United States with a correlation coefficient (R) of -0.471 and weighted average of $91,087. Similarly, the statistical analysis conducted on geographies consisting of 56,095,481 people shows a moderate negative correlation between the proportion of Kiowa and median family income in the United States with a correlation coefficient (R) of -0.421 and weighted average of $80,885, a difference of 12.6%.
Median Family Income Correlation Summary
| Measurement | Central American | Kiowa |
| Minimum | $27,406 | $36,250 |
| Maximum | $109,579 | $102,708 |
| Range | $82,173 | $66,458 |
| Mean | $81,381 | $68,555 |
| Median | $84,167 | $67,750 |
| Interquartile 25% (IQ1) | $70,836 | $60,573 |
| Interquartile 75% (IQ3) | $93,875 | $79,021 |
| Interquartile Range (IQR) | $23,039 | $18,448 |
| Standard Deviation (Sample) | $17,262 | $15,572 |
| Standard Deviation (Population) | $17,169 | $15,360 |
Similar Demographics by Median Family Income
Demographics Similar to Central Americans by Median Family Income
In terms of median family income, the demographic groups most similar to Central Americans are Mexican American Indian ($90,918, a difference of 0.19%), Hmong ($91,296, a difference of 0.23%), Cree ($90,882, a difference of 0.23%), Belizean ($90,880, a difference of 0.23%), and Senegalese ($91,475, a difference of 0.43%).
| Demographics | Rating | Rank | Median Family Income |
| Cape Verdeans | 0.4 /100 | #259 | Tragic $91,848 |
| Pennsylvania Germans | 0.4 /100 | #260 | Tragic $91,763 |
| Inupiat | 0.4 /100 | #261 | Tragic $91,730 |
| Liberians | 0.4 /100 | #262 | Tragic $91,722 |
| Immigrants | West Indies | 0.3 /100 | #263 | Tragic $91,588 |
| Senegalese | 0.3 /100 | #264 | Tragic $91,475 |
| Hmong | 0.3 /100 | #265 | Tragic $91,296 |
| Central Americans | 0.3 /100 | #266 | Tragic $91,087 |
| Mexican American Indians | 0.2 /100 | #267 | Tragic $90,918 |
| Cree | 0.2 /100 | #268 | Tragic $90,882 |
| Belizeans | 0.2 /100 | #269 | Tragic $90,880 |
| Jamaicans | 0.2 /100 | #270 | Tragic $90,581 |
| Iroquois | 0.2 /100 | #271 | Tragic $90,543 |
| Immigrants | Liberia | 0.2 /100 | #272 | Tragic $90,450 |
| Immigrants | Micronesia | 0.2 /100 | #273 | Tragic $90,345 |
Demographics Similar to Kiowa by Median Family Income
In terms of median family income, the demographic groups most similar to Kiowa are Native/Alaskan ($80,908, a difference of 0.030%), Immigrants from Dominican Republic ($81,233, a difference of 0.43%), Cheyenne ($81,385, a difference of 0.62%), Dutch West Indian ($81,852, a difference of 1.2%), and Black/African American ($81,912, a difference of 1.3%).
| Demographics | Rating | Rank | Median Family Income |
| Immigrants | Congo | 0.0 /100 | #326 | Tragic $82,216 |
| Arapaho | 0.0 /100 | #327 | Tragic $82,064 |
| Blacks/African Americans | 0.0 /100 | #328 | Tragic $81,912 |
| Dutch West Indians | 0.0 /100 | #329 | Tragic $81,852 |
| Cheyenne | 0.0 /100 | #330 | Tragic $81,385 |
| Immigrants | Dominican Republic | 0.0 /100 | #331 | Tragic $81,233 |
| Natives/Alaskans | 0.0 /100 | #332 | Tragic $80,908 |
| Kiowa | 0.0 /100 | #333 | Tragic $80,885 |
| Menominee | 0.0 /100 | #334 | Tragic $79,563 |
| Yup'ik | 0.0 /100 | #335 | Tragic $79,290 |
| Immigrants | Cuba | 0.0 /100 | #336 | Tragic $78,249 |
| Yuman | 0.0 /100 | #337 | Tragic $78,055 |
| Immigrants | Yemen | 0.0 /100 | #338 | Tragic $77,457 |
| Pima | 0.0 /100 | #339 | Tragic $77,431 |
| Hopi | 0.0 /100 | #340 | Tragic $77,188 |