Immigrants from Cambodia vs Immigrants from India Median Family Income
COMPARE
Immigrants from Cambodia
Immigrants from India
Median Family Income
Median Family Income Comparison
Immigrants from Cambodia
Immigrants from India
$97,222
MEDIAN FAMILY INCOME
5.8/ 100
METRIC RATING
218th/ 347
METRIC RANK
$134,028
MEDIAN FAMILY INCOME
100.0/ 100
METRIC RATING
4th/ 347
METRIC RANK
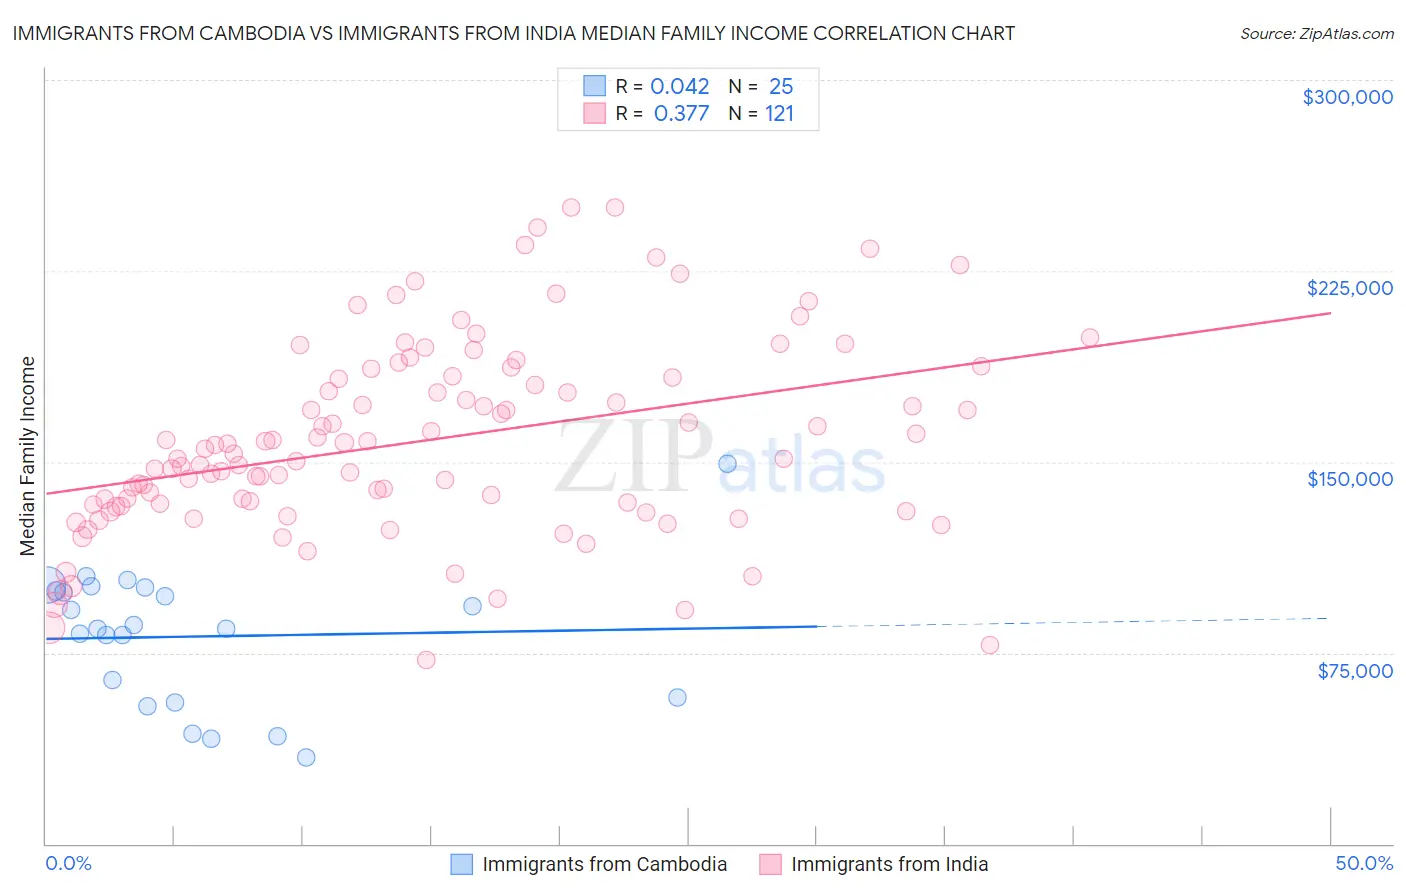
Immigrants from Cambodia vs Immigrants from India Median Family Income Correlation Chart
The statistical analysis conducted on geographies consisting of 205,119,911 people shows no correlation between the proportion of Immigrants from Cambodia and median family income in the United States with a correlation coefficient (R) of 0.042 and weighted average of $97,222. Similarly, the statistical analysis conducted on geographies consisting of 433,562,423 people shows a mild positive correlation between the proportion of Immigrants from India and median family income in the United States with a correlation coefficient (R) of 0.377 and weighted average of $134,028, a difference of 37.9%.
Median Family Income Correlation Summary
| Measurement | Immigrants from Cambodia | Immigrants from India |
| Minimum | $34,076 | $71,983 |
| Maximum | $149,239 | $250,001 |
| Range | $115,163 | $178,018 |
| Mean | $81,395 | $158,155 |
| Median | $84,615 | $153,095 |
| Interquartile 25% (IQ1) | $56,570 | $132,876 |
| Interquartile 75% (IQ3) | $99,835 | $183,418 |
| Interquartile Range (IQR) | $43,265 | $50,542 |
| Standard Deviation (Sample) | $26,680 | $37,573 |
| Standard Deviation (Population) | $26,141 | $37,418 |
Similar Demographics by Median Family Income
Demographics Similar to Immigrants from Cambodia by Median Family Income
In terms of median family income, the demographic groups most similar to Immigrants from Cambodia are Japanese ($97,288, a difference of 0.070%), Immigrants from Bosnia and Herzegovina ($97,432, a difference of 0.22%), Delaware ($96,958, a difference of 0.27%), Nigerian ($97,522, a difference of 0.31%), and Bermudan ($97,577, a difference of 0.36%).
| Demographics | Rating | Rank | Median Family Income |
| Immigrants | Sudan | 7.4 /100 | #211 | Tragic $97,737 |
| Panamanians | 7.2 /100 | #212 | Tragic $97,683 |
| Immigrants | Armenia | 7.0 /100 | #213 | Tragic $97,605 |
| Bermudans | 6.9 /100 | #214 | Tragic $97,577 |
| Nigerians | 6.7 /100 | #215 | Tragic $97,522 |
| Immigrants | Bosnia and Herzegovina | 6.4 /100 | #216 | Tragic $97,432 |
| Japanese | 6.0 /100 | #217 | Tragic $97,288 |
| Immigrants | Cambodia | 5.8 /100 | #218 | Tragic $97,222 |
| Delaware | 5.1 /100 | #219 | Tragic $96,958 |
| Sudanese | 4.7 /100 | #220 | Tragic $96,783 |
| Immigrants | Ghana | 4.2 /100 | #221 | Tragic $96,544 |
| Immigrants | Nigeria | 4.0 /100 | #222 | Tragic $96,439 |
| Venezuelans | 3.7 /100 | #223 | Tragic $96,281 |
| Immigrants | Nonimmigrants | 3.6 /100 | #224 | Tragic $96,231 |
| Vietnamese | 3.4 /100 | #225 | Tragic $96,123 |
Demographics Similar to Immigrants from India by Median Family Income
In terms of median family income, the demographic groups most similar to Immigrants from India are Iranian ($133,839, a difference of 0.14%), Immigrants from Singapore ($134,818, a difference of 0.59%), Thai ($131,281, a difference of 2.1%), Immigrants from Taiwan ($136,949, a difference of 2.2%), and Immigrants from Hong Kong ($131,067, a difference of 2.3%).
| Demographics | Rating | Rank | Median Family Income |
| Filipinos | 100.0 /100 | #1 | Exceptional $138,397 |
| Immigrants | Taiwan | 100.0 /100 | #2 | Exceptional $136,949 |
| Immigrants | Singapore | 100.0 /100 | #3 | Exceptional $134,818 |
| Immigrants | India | 100.0 /100 | #4 | Exceptional $134,028 |
| Iranians | 100.0 /100 | #5 | Exceptional $133,839 |
| Thais | 100.0 /100 | #6 | Exceptional $131,281 |
| Immigrants | Hong Kong | 100.0 /100 | #7 | Exceptional $131,067 |
| Immigrants | Iran | 100.0 /100 | #8 | Exceptional $130,894 |
| Okinawans | 100.0 /100 | #9 | Exceptional $129,979 |
| Immigrants | Ireland | 100.0 /100 | #10 | Exceptional $127,584 |
| Immigrants | Israel | 100.0 /100 | #11 | Exceptional $127,430 |
| Cypriots | 100.0 /100 | #12 | Exceptional $127,064 |
| Immigrants | Australia | 100.0 /100 | #13 | Exceptional $126,620 |
| Immigrants | South Central Asia | 100.0 /100 | #14 | Exceptional $125,956 |
| Eastern Europeans | 100.0 /100 | #15 | Exceptional $125,546 |