Carpatho Rusyn vs Ottawa Doctorate Degree
COMPARE
Carpatho Rusyn
Ottawa
Doctorate Degree
Doctorate Degree Comparison
Carpatho Rusyns
Ottawa
2.3%
DOCTORATE DEGREE
99.8/ 100
METRIC RATING
69th/ 347
METRIC RANK
1.6%
DOCTORATE DEGREE
2.2/ 100
METRIC RATING
242nd/ 347
METRIC RANK
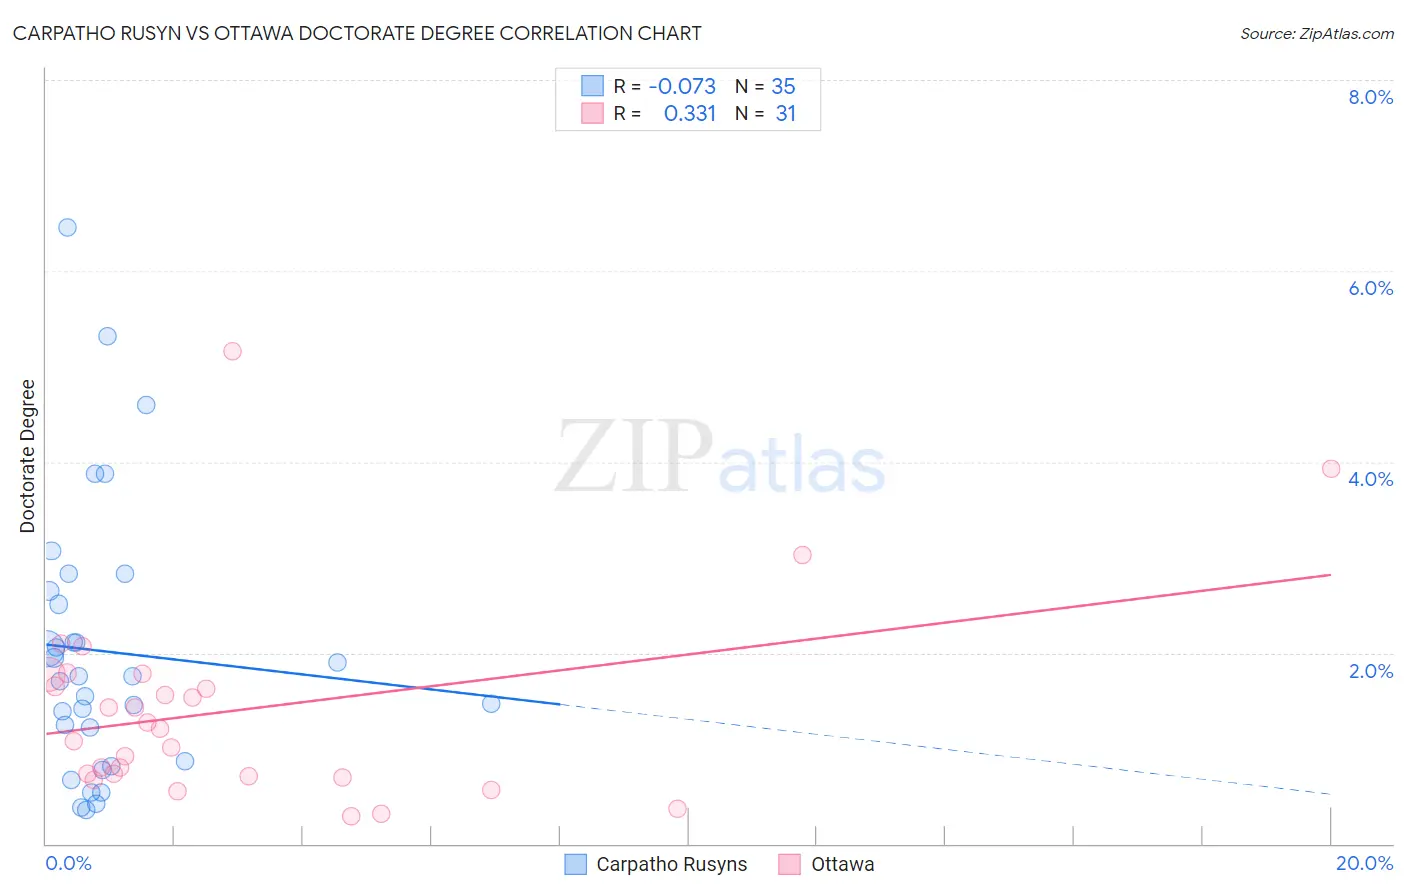
Carpatho Rusyn vs Ottawa Doctorate Degree Correlation Chart
The statistical analysis conducted on geographies consisting of 58,704,885 people shows a slight negative correlation between the proportion of Carpatho Rusyns and percentage of population with at least doctorate degree education in the United States with a correlation coefficient (R) of -0.073 and weighted average of 2.3%. Similarly, the statistical analysis conducted on geographies consisting of 49,607,860 people shows a mild positive correlation between the proportion of Ottawa and percentage of population with at least doctorate degree education in the United States with a correlation coefficient (R) of 0.331 and weighted average of 1.6%, a difference of 42.9%.
Doctorate Degree Correlation Summary
| Measurement | Carpatho Rusyn | Ottawa |
| Minimum | 0.35% | 0.29% |
| Maximum | 6.5% | 5.2% |
| Range | 6.1% | 4.9% |
| Mean | 2.0% | 1.4% |
| Median | 1.8% | 1.2% |
| Interquartile 25% (IQ1) | 0.86% | 0.70% |
| Interquartile 75% (IQ3) | 2.6% | 1.8% |
| Interquartile Range (IQR) | 1.8% | 1.1% |
| Standard Deviation (Sample) | 1.4% | 1.1% |
| Standard Deviation (Population) | 1.4% | 1.0% |
Similar Demographics by Doctorate Degree
Demographics Similar to Carpatho Rusyns by Doctorate Degree
In terms of doctorate degree, the demographic groups most similar to Carpatho Rusyns are Lithuanian (2.3%, a difference of 0.14%), Immigrants from Bolivia (2.3%, a difference of 0.14%), Immigrants from Kazakhstan (2.3%, a difference of 0.25%), Immigrants from Canada (2.3%, a difference of 0.30%), and Immigrants from Bulgaria (2.3%, a difference of 0.38%).
| Demographics | Rating | Rank | Doctorate Degree |
| Immigrants | Europe | 99.9 /100 | #62 | Exceptional 2.3% |
| Laotians | 99.9 /100 | #63 | Exceptional 2.3% |
| Immigrants | Greece | 99.9 /100 | #64 | Exceptional 2.3% |
| Paraguayans | 99.9 /100 | #65 | Exceptional 2.3% |
| Argentineans | 99.9 /100 | #66 | Exceptional 2.3% |
| Zimbabweans | 99.8 /100 | #67 | Exceptional 2.3% |
| Immigrants | Kazakhstan | 99.8 /100 | #68 | Exceptional 2.3% |
| Carpatho Rusyns | 99.8 /100 | #69 | Exceptional 2.3% |
| Lithuanians | 99.8 /100 | #70 | Exceptional 2.3% |
| Immigrants | Bolivia | 99.8 /100 | #71 | Exceptional 2.3% |
| Immigrants | Canada | 99.8 /100 | #72 | Exceptional 2.3% |
| Immigrants | Bulgaria | 99.8 /100 | #73 | Exceptional 2.3% |
| Immigrants | North America | 99.8 /100 | #74 | Exceptional 2.2% |
| Immigrants | Western Asia | 99.8 /100 | #75 | Exceptional 2.2% |
| Immigrants | Hungary | 99.8 /100 | #76 | Exceptional 2.2% |
Demographics Similar to Ottawa by Doctorate Degree
In terms of doctorate degree, the demographic groups most similar to Ottawa are Native Hawaiian (1.6%, a difference of 0.13%), Cheyenne (1.6%, a difference of 0.21%), French American Indian (1.6%, a difference of 0.32%), Immigrants from Panama (1.6%, a difference of 0.40%), and West Indian (1.6%, a difference of 0.59%).
| Demographics | Rating | Rank | Doctorate Degree |
| Cree | 3.0 /100 | #235 | Tragic 1.6% |
| Indonesians | 2.8 /100 | #236 | Tragic 1.6% |
| Iroquois | 2.7 /100 | #237 | Tragic 1.6% |
| Immigrants | Congo | 2.6 /100 | #238 | Tragic 1.6% |
| West Indians | 2.5 /100 | #239 | Tragic 1.6% |
| Immigrants | Panama | 2.4 /100 | #240 | Tragic 1.6% |
| Cheyenne | 2.3 /100 | #241 | Tragic 1.6% |
| Ottawa | 2.2 /100 | #242 | Tragic 1.6% |
| Native Hawaiians | 2.1 /100 | #243 | Tragic 1.6% |
| French American Indians | 2.0 /100 | #244 | Tragic 1.6% |
| Delaware | 1.9 /100 | #245 | Tragic 1.6% |
| Hmong | 1.8 /100 | #246 | Tragic 1.6% |
| Comanche | 1.8 /100 | #247 | Tragic 1.6% |
| Africans | 1.8 /100 | #248 | Tragic 1.6% |
| Potawatomi | 1.6 /100 | #249 | Tragic 1.6% |