Immigrants from Peru vs Immigrants from Middle Africa Householder Income Under 25 years
COMPARE
Immigrants from Peru
Immigrants from Middle Africa
Householder Income Under 25 years
Householder Income Under 25 years Comparison
Immigrants from Peru
Immigrants from Middle Africa
$56,384
HOUSEHOLDER INCOME UNDER 25 YEARS
100.0/ 100
METRIC RATING
28th/ 347
METRIC RANK
$47,916
HOUSEHOLDER INCOME UNDER 25 YEARS
0.0/ 100
METRIC RATING
303rd/ 347
METRIC RANK
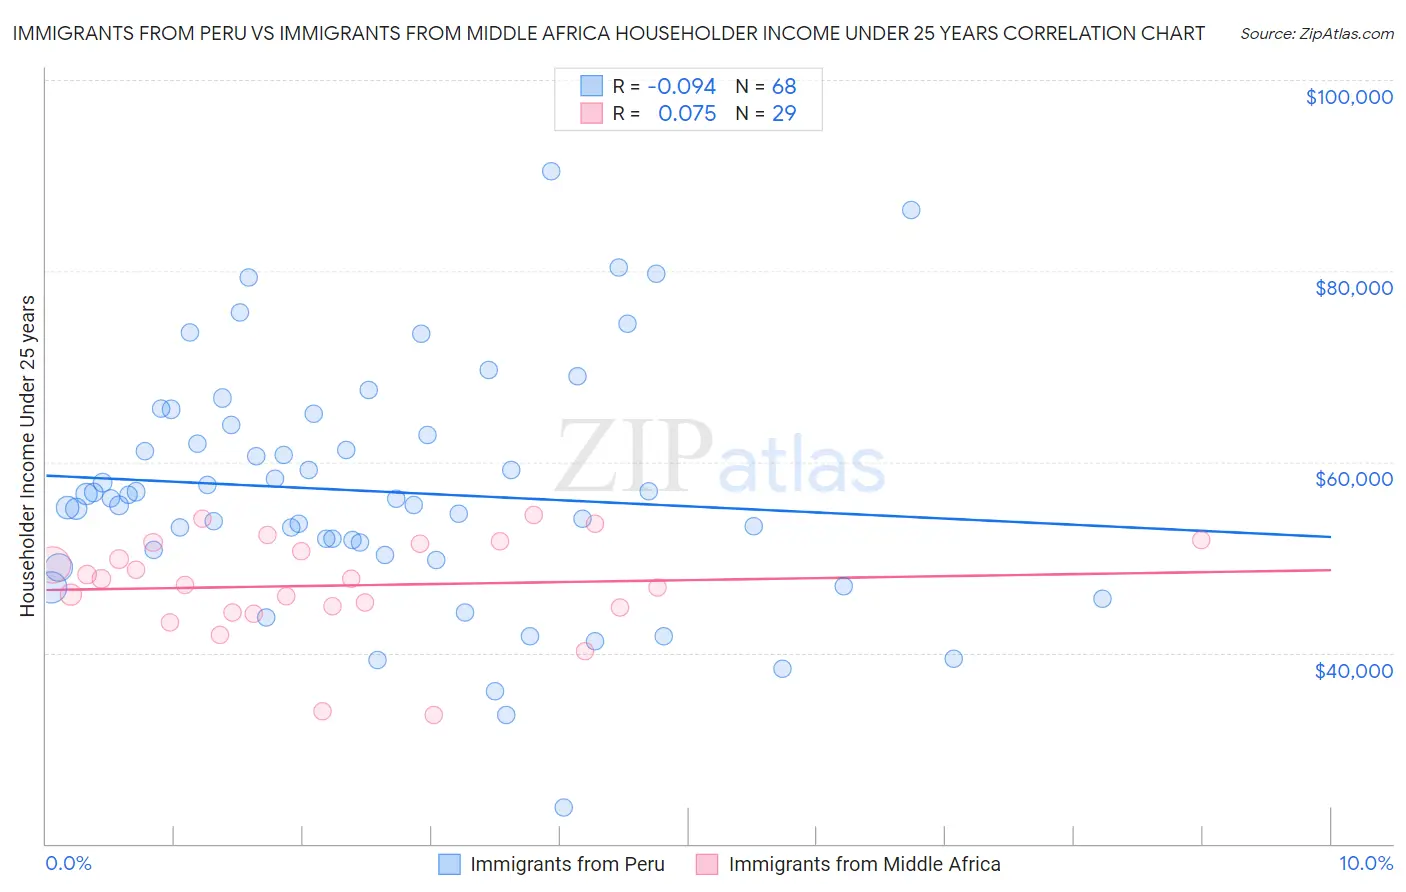
Immigrants from Peru vs Immigrants from Middle Africa Householder Income Under 25 years Correlation Chart
The statistical analysis conducted on geographies consisting of 281,649,293 people shows a slight negative correlation between the proportion of Immigrants from Peru and household income with householder under the age of 25 in the United States with a correlation coefficient (R) of -0.094 and weighted average of $56,384. Similarly, the statistical analysis conducted on geographies consisting of 185,124,339 people shows a slight positive correlation between the proportion of Immigrants from Middle Africa and household income with householder under the age of 25 in the United States with a correlation coefficient (R) of 0.075 and weighted average of $47,916, a difference of 17.7%.
Householder Income Under 25 years Correlation Summary
| Measurement | Immigrants from Peru | Immigrants from Middle Africa |
| Minimum | $23,750 | $33,425 |
| Maximum | $90,496 | $54,425 |
| Range | $66,746 | $21,000 |
| Mean | $56,893 | $47,045 |
| Median | $56,174 | $47,736 |
| Interquartile 25% (IQ1) | $50,499 | $44,499 |
| Interquartile 75% (IQ3) | $63,350 | $51,465 |
| Interquartile Range (IQR) | $12,851 | $6,966 |
| Standard Deviation (Sample) | $12,520 | $5,237 |
| Standard Deviation (Population) | $12,427 | $5,146 |
Similar Demographics by Householder Income Under 25 years
Demographics Similar to Immigrants from Peru by Householder Income Under 25 years
In terms of householder income under 25 years, the demographic groups most similar to Immigrants from Peru are Immigrants from Asia ($56,379, a difference of 0.010%), Immigrants from North Macedonia ($56,503, a difference of 0.21%), Immigrants from Moldova ($56,168, a difference of 0.38%), Vietnamese ($56,127, a difference of 0.46%), and Immigrants from Australia ($56,660, a difference of 0.49%).
| Demographics | Rating | Rank | Householder Income Under 25 years |
| Immigrants | Fiji | 100.0 /100 | #21 | Exceptional $57,074 |
| Asians | 100.0 /100 | #22 | Exceptional $57,003 |
| Tongans | 100.0 /100 | #23 | Exceptional $56,972 |
| Immigrants | Singapore | 100.0 /100 | #24 | Exceptional $56,835 |
| Immigrants | Pakistan | 100.0 /100 | #25 | Exceptional $56,789 |
| Immigrants | Australia | 100.0 /100 | #26 | Exceptional $56,660 |
| Immigrants | North Macedonia | 100.0 /100 | #27 | Exceptional $56,503 |
| Immigrants | Peru | 100.0 /100 | #28 | Exceptional $56,384 |
| Immigrants | Asia | 100.0 /100 | #29 | Exceptional $56,379 |
| Immigrants | Moldova | 100.0 /100 | #30 | Exceptional $56,168 |
| Vietnamese | 100.0 /100 | #31 | Exceptional $56,127 |
| Peruvians | 100.0 /100 | #32 | Exceptional $56,052 |
| Inupiat | 100.0 /100 | #33 | Exceptional $55,935 |
| Immigrants | Japan | 100.0 /100 | #34 | Exceptional $55,932 |
| Tlingit-Haida | 100.0 /100 | #35 | Exceptional $55,914 |
Demographics Similar to Immigrants from Middle Africa by Householder Income Under 25 years
In terms of householder income under 25 years, the demographic groups most similar to Immigrants from Middle Africa are Menominee ($47,907, a difference of 0.020%), Immigrants from Liberia ($47,981, a difference of 0.14%), Cherokee ($47,848, a difference of 0.14%), Immigrants from Kuwait ($48,126, a difference of 0.44%), and Native/Alaskan ($47,704, a difference of 0.44%).
| Demographics | Rating | Rank | Householder Income Under 25 years |
| Blackfeet | 0.0 /100 | #296 | Tragic $48,603 |
| Cree | 0.0 /100 | #297 | Tragic $48,514 |
| Yaqui | 0.0 /100 | #298 | Tragic $48,300 |
| Immigrants | Honduras | 0.0 /100 | #299 | Tragic $48,267 |
| Immigrants | Somalia | 0.0 /100 | #300 | Tragic $48,135 |
| Immigrants | Kuwait | 0.0 /100 | #301 | Tragic $48,126 |
| Immigrants | Liberia | 0.0 /100 | #302 | Tragic $47,981 |
| Immigrants | Middle Africa | 0.0 /100 | #303 | Tragic $47,916 |
| Menominee | 0.0 /100 | #304 | Tragic $47,907 |
| Cherokee | 0.0 /100 | #305 | Tragic $47,848 |
| Natives/Alaskans | 0.0 /100 | #306 | Tragic $47,704 |
| Bangladeshis | 0.0 /100 | #307 | Tragic $47,589 |
| Comanche | 0.0 /100 | #308 | Tragic $47,518 |
| U.S. Virgin Islanders | 0.0 /100 | #309 | Tragic $47,448 |
| Iroquois | 0.0 /100 | #310 | Tragic $47,380 |