Carpatho Rusyn vs Shoshone Per Capita Income
COMPARE
Carpatho Rusyn
Shoshone
Per Capita Income
Per Capita Income Comparison
Carpatho Rusyns
Shoshone
$47,248
PER CAPITA INCOME
98.2/ 100
METRIC RATING
97th/ 347
METRIC RANK
$37,072
PER CAPITA INCOME
0.1/ 100
METRIC RATING
302nd/ 347
METRIC RANK
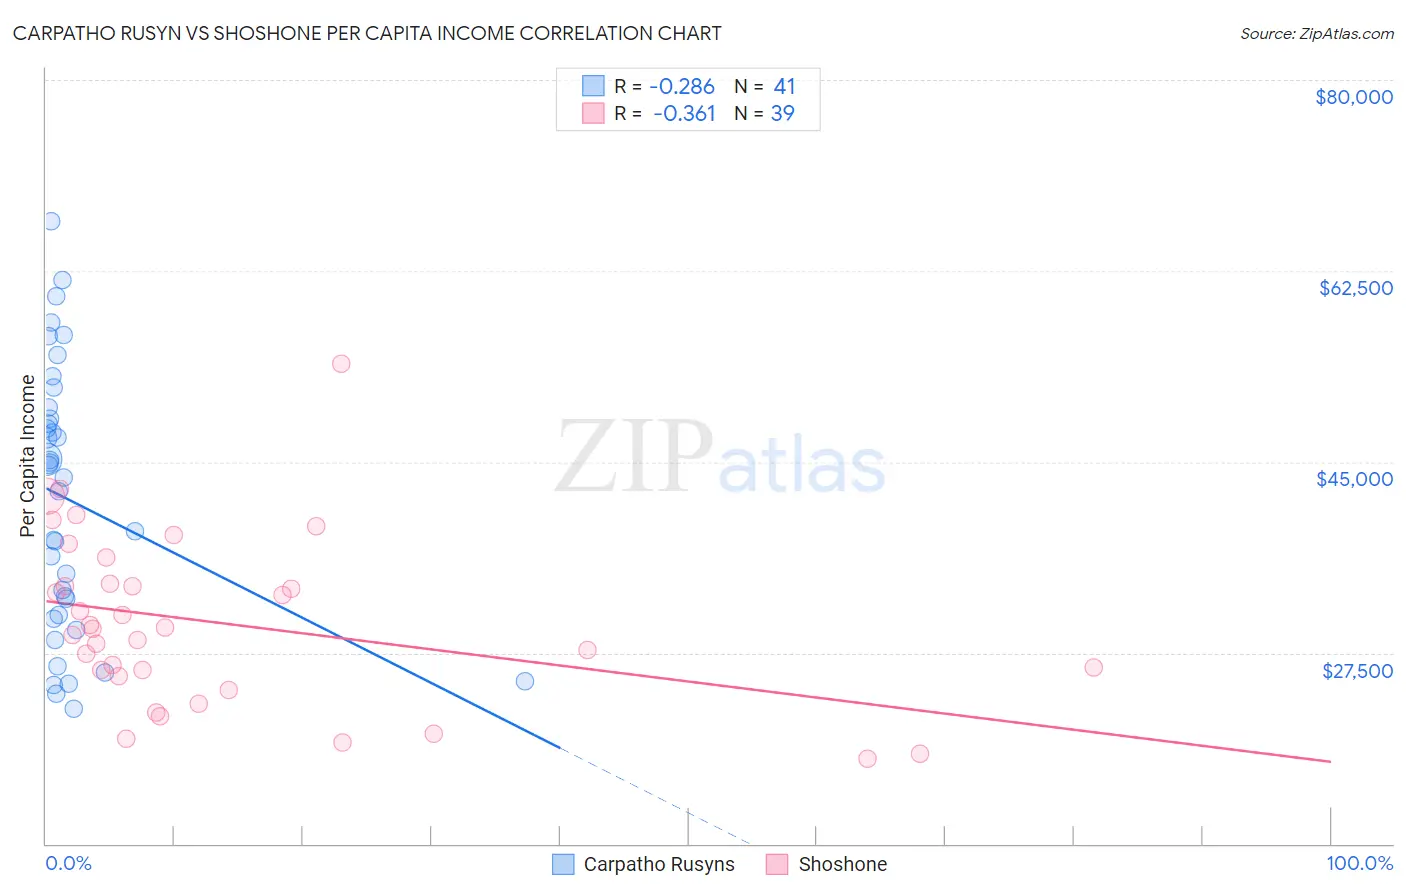
Carpatho Rusyn vs Shoshone Per Capita Income Correlation Chart
The statistical analysis conducted on geographies consisting of 58,866,831 people shows a weak negative correlation between the proportion of Carpatho Rusyns and per capita income in the United States with a correlation coefficient (R) of -0.286 and weighted average of $47,248. Similarly, the statistical analysis conducted on geographies consisting of 66,627,177 people shows a mild negative correlation between the proportion of Shoshone and per capita income in the United States with a correlation coefficient (R) of -0.361 and weighted average of $37,072, a difference of 27.5%.
Per Capita Income Correlation Summary
| Measurement | Carpatho Rusyn | Shoshone |
| Minimum | $22,343 | $17,814 |
| Maximum | $67,093 | $54,019 |
| Range | $44,750 | $36,205 |
| Mean | $41,437 | $30,204 |
| Median | $43,602 | $29,691 |
| Interquartile 25% (IQ1) | $30,789 | $25,299 |
| Interquartile 75% (IQ3) | $49,474 | $33,868 |
| Interquartile Range (IQR) | $18,684 | $8,569 |
| Standard Deviation (Sample) | $12,046 | $7,800 |
| Standard Deviation (Population) | $11,898 | $7,700 |
Similar Demographics by Per Capita Income
Demographics Similar to Carpatho Rusyns by Per Capita Income
In terms of per capita income, the demographic groups most similar to Carpatho Rusyns are Alsatian ($47,284, a difference of 0.080%), Immigrants from Egypt ($47,361, a difference of 0.24%), Albanian ($47,379, a difference of 0.28%), Immigrants from Zimbabwe ($47,394, a difference of 0.31%), and Immigrants from Pakistan ($47,084, a difference of 0.35%).
| Demographics | Rating | Rank | Per Capita Income |
| Italians | 98.8 /100 | #90 | Exceptional $47,574 |
| Macedonians | 98.8 /100 | #91 | Exceptional $47,573 |
| Immigrants | Moldova | 98.7 /100 | #92 | Exceptional $47,489 |
| Immigrants | Zimbabwe | 98.5 /100 | #93 | Exceptional $47,394 |
| Albanians | 98.5 /100 | #94 | Exceptional $47,379 |
| Immigrants | Egypt | 98.5 /100 | #95 | Exceptional $47,361 |
| Alsatians | 98.3 /100 | #96 | Exceptional $47,284 |
| Carpatho Rusyns | 98.2 /100 | #97 | Exceptional $47,248 |
| Immigrants | Pakistan | 97.9 /100 | #98 | Exceptional $47,084 |
| Laotians | 97.8 /100 | #99 | Exceptional $47,041 |
| Immigrants | Lebanon | 97.5 /100 | #100 | Exceptional $46,938 |
| Immigrants | Uzbekistan | 97.5 /100 | #101 | Exceptional $46,929 |
| Immigrants | Western Asia | 97.4 /100 | #102 | Exceptional $46,876 |
| Syrians | 97.2 /100 | #103 | Exceptional $46,837 |
| Brazilians | 96.8 /100 | #104 | Exceptional $46,700 |
Demographics Similar to Shoshone by Per Capita Income
In terms of per capita income, the demographic groups most similar to Shoshone are Paiute ($37,066, a difference of 0.020%), Ottawa ($37,101, a difference of 0.080%), Honduran ($37,031, a difference of 0.11%), Inupiat ($36,999, a difference of 0.20%), and Immigrants from Bahamas ($37,193, a difference of 0.33%).
| Demographics | Rating | Rank | Per Capita Income |
| Immigrants | Dominican Republic | 0.1 /100 | #295 | Tragic $37,306 |
| Indonesians | 0.1 /100 | #296 | Tragic $37,300 |
| Haitians | 0.1 /100 | #297 | Tragic $37,289 |
| Immigrants | Caribbean | 0.1 /100 | #298 | Tragic $37,254 |
| Cherokee | 0.1 /100 | #299 | Tragic $37,203 |
| Immigrants | Bahamas | 0.1 /100 | #300 | Tragic $37,193 |
| Ottawa | 0.1 /100 | #301 | Tragic $37,101 |
| Shoshone | 0.1 /100 | #302 | Tragic $37,072 |
| Paiute | 0.1 /100 | #303 | Tragic $37,066 |
| Hondurans | 0.1 /100 | #304 | Tragic $37,031 |
| Inupiat | 0.1 /100 | #305 | Tragic $36,999 |
| Immigrants | Haiti | 0.0 /100 | #306 | Tragic $36,849 |
| Immigrants | Latin America | 0.0 /100 | #307 | Tragic $36,823 |
| Fijians | 0.0 /100 | #308 | Tragic $36,690 |
| Immigrants | Honduras | 0.0 /100 | #309 | Tragic $36,665 |