Cambodian vs Senegalese Unemployment Among Ages 16 to 19 years
COMPARE
Cambodian
Senegalese
Unemployment Among Ages 16 to 19 years
Unemployment Among Ages 16 to 19 years Comparison
Cambodians
Senegalese
16.9%
UNEMPLOYMENT AMONG AGES 16 TO 19 YEARS
96.3/ 100
METRIC RATING
91st/ 347
METRIC RANK
21.0%
UNEMPLOYMENT AMONG AGES 16 TO 19 YEARS
0.0/ 100
METRIC RATING
303rd/ 347
METRIC RANK
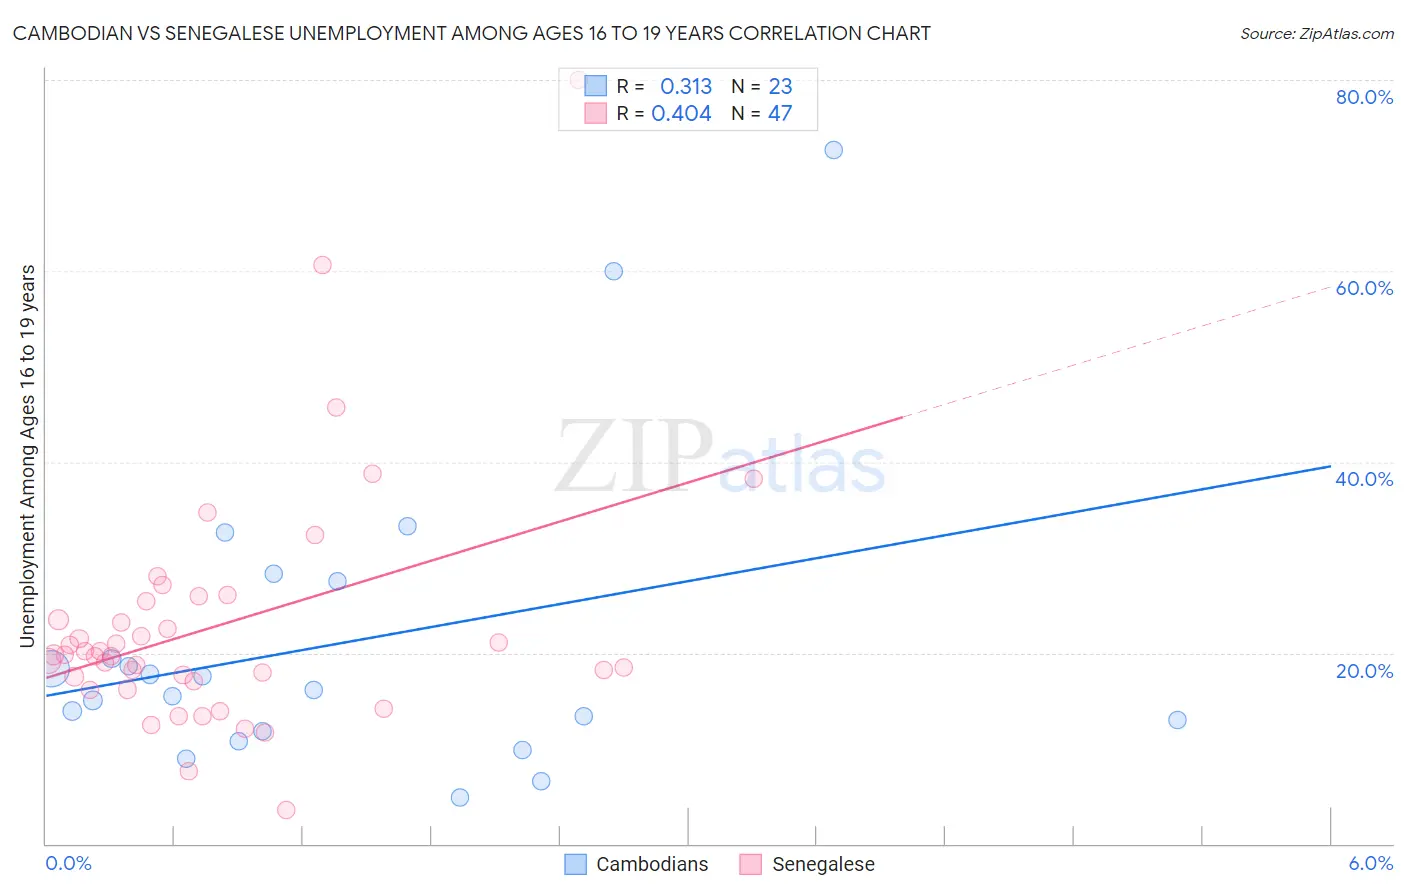
Cambodian vs Senegalese Unemployment Among Ages 16 to 19 years Correlation Chart
The statistical analysis conducted on geographies consisting of 100,775,991 people shows a mild positive correlation between the proportion of Cambodians and unemployment rate among population between the ages 16 and 19 in the United States with a correlation coefficient (R) of 0.313 and weighted average of 16.9%. Similarly, the statistical analysis conducted on geographies consisting of 77,377,459 people shows a moderate positive correlation between the proportion of Senegalese and unemployment rate among population between the ages 16 and 19 in the United States with a correlation coefficient (R) of 0.404 and weighted average of 21.0%, a difference of 24.1%.
Unemployment Among Ages 16 to 19 years Correlation Summary
| Measurement | Cambodian | Senegalese |
| Minimum | 4.9% | 3.6% |
| Maximum | 72.7% | 80.0% |
| Range | 67.8% | 76.4% |
| Mean | 21.1% | 22.8% |
| Median | 16.2% | 19.8% |
| Interquartile 25% (IQ1) | 11.8% | 17.0% |
| Interquartile 75% (IQ3) | 27.4% | 25.4% |
| Interquartile Range (IQR) | 15.6% | 8.3% |
| Standard Deviation (Sample) | 16.3% | 12.9% |
| Standard Deviation (Population) | 15.9% | 12.8% |
Similar Demographics by Unemployment Among Ages 16 to 19 years
Demographics Similar to Cambodians by Unemployment Among Ages 16 to 19 years
In terms of unemployment among ages 16 to 19 years, the demographic groups most similar to Cambodians are Asian (16.9%, a difference of 0.080%), Canadian (16.9%, a difference of 0.12%), South African (16.9%, a difference of 0.13%), Cuban (16.9%, a difference of 0.17%), and Bangladeshi (16.9%, a difference of 0.19%).
| Demographics | Rating | Rank | Unemployment Among Ages 16 to 19 years |
| French | 97.4 /100 | #84 | Exceptional 16.8% |
| Immigrants | Kuwait | 97.2 /100 | #85 | Exceptional 16.8% |
| Immigrants | Scotland | 97.2 /100 | #86 | Exceptional 16.8% |
| Greeks | 97.0 /100 | #87 | Exceptional 16.9% |
| Immigrants | South Africa | 96.9 /100 | #88 | Exceptional 16.9% |
| Canadians | 96.7 /100 | #89 | Exceptional 16.9% |
| Asians | 96.6 /100 | #90 | Exceptional 16.9% |
| Cambodians | 96.3 /100 | #91 | Exceptional 16.9% |
| South Africans | 95.9 /100 | #92 | Exceptional 16.9% |
| Cubans | 95.8 /100 | #93 | Exceptional 16.9% |
| Bangladeshis | 95.8 /100 | #94 | Exceptional 16.9% |
| Mongolians | 95.6 /100 | #95 | Exceptional 16.9% |
| Ottawa | 95.4 /100 | #96 | Exceptional 16.9% |
| Immigrants | Venezuela | 95.3 /100 | #97 | Exceptional 16.9% |
| Burmese | 95.0 /100 | #98 | Exceptional 17.0% |
Demographics Similar to Senegalese by Unemployment Among Ages 16 to 19 years
In terms of unemployment among ages 16 to 19 years, the demographic groups most similar to Senegalese are Immigrants from Caribbean (20.9%, a difference of 0.38%), Immigrants from Ecuador (20.9%, a difference of 0.49%), Aleut (21.2%, a difference of 0.86%), Immigrants from Senegal (21.2%, a difference of 1.0%), and U.S. Virgin Islander (21.3%, a difference of 1.4%).
| Demographics | Rating | Rank | Unemployment Among Ages 16 to 19 years |
| Armenians | 0.0 /100 | #296 | Tragic 20.5% |
| Alsatians | 0.0 /100 | #297 | Tragic 20.5% |
| Haitians | 0.0 /100 | #298 | Tragic 20.5% |
| Immigrants | Uzbekistan | 0.0 /100 | #299 | Tragic 20.5% |
| Ecuadorians | 0.0 /100 | #300 | Tragic 20.5% |
| Immigrants | Ecuador | 0.0 /100 | #301 | Tragic 20.9% |
| Immigrants | Caribbean | 0.0 /100 | #302 | Tragic 20.9% |
| Senegalese | 0.0 /100 | #303 | Tragic 21.0% |
| Aleuts | 0.0 /100 | #304 | Tragic 21.2% |
| Immigrants | Senegal | 0.0 /100 | #305 | Tragic 21.2% |
| U.S. Virgin Islanders | 0.0 /100 | #306 | Tragic 21.3% |
| Blacks/African Americans | 0.0 /100 | #307 | Tragic 21.4% |
| Immigrants | Bangladesh | 0.0 /100 | #308 | Tragic 21.5% |
| Natives/Alaskans | 0.0 /100 | #309 | Tragic 21.5% |
| Vietnamese | 0.0 /100 | #310 | Tragic 21.5% |