Immigrants from Oceania vs Immigrants from Northern Europe Median Male Earnings
COMPARE
Immigrants from Oceania
Immigrants from Northern Europe
Median Male Earnings
Median Male Earnings Comparison
Immigrants from Oceania
Immigrants from Northern Europe
$55,712
MEDIAN MALE EARNINGS
76.8/ 100
METRIC RATING
151st/ 347
METRIC RANK
$64,987
MEDIAN MALE EARNINGS
100.0/ 100
METRIC RATING
24th/ 347
METRIC RANK
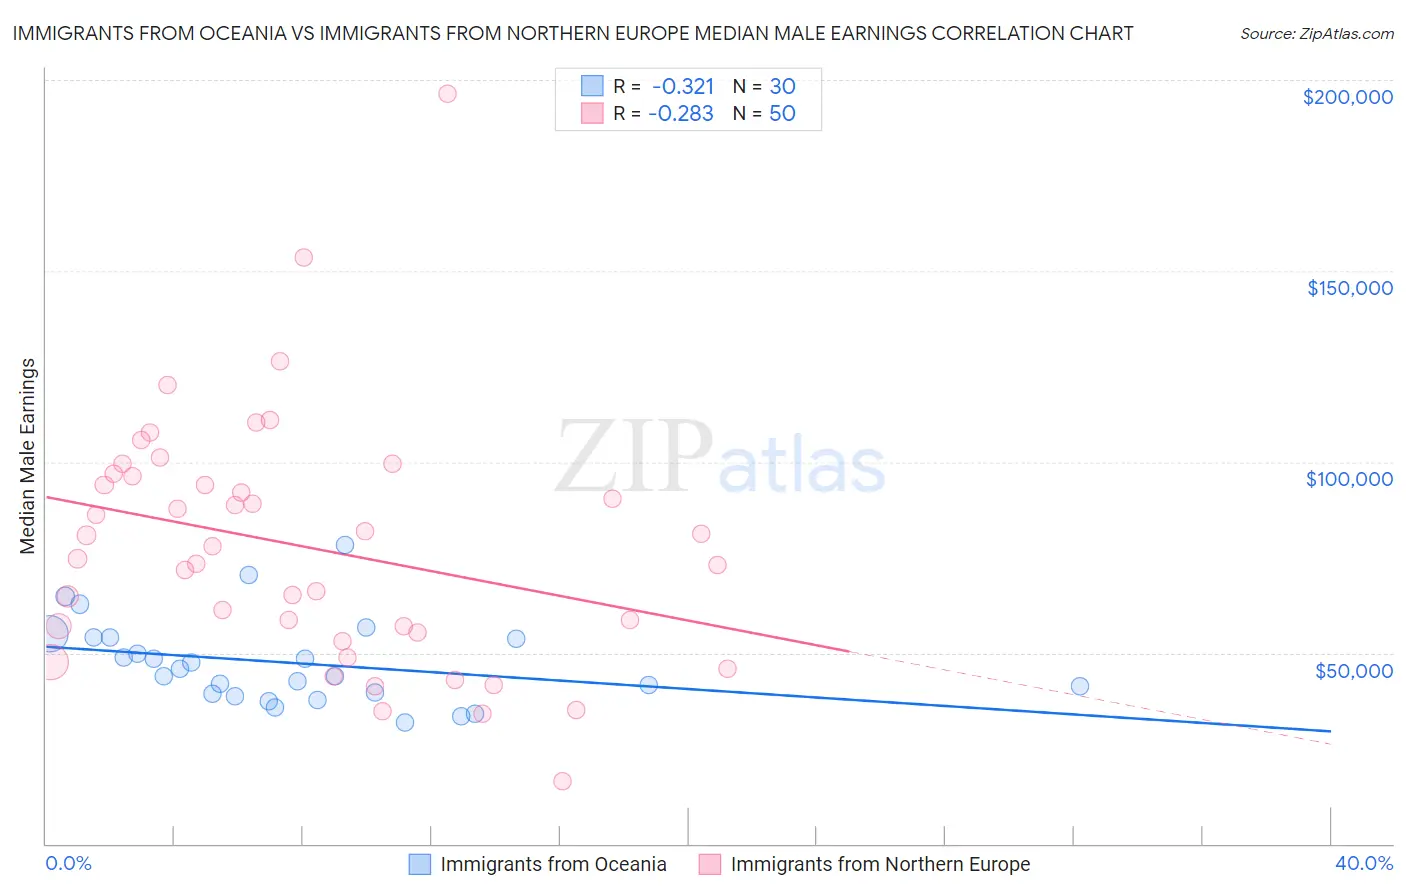
Immigrants from Oceania vs Immigrants from Northern Europe Median Male Earnings Correlation Chart
The statistical analysis conducted on geographies consisting of 305,444,648 people shows a mild negative correlation between the proportion of Immigrants from Oceania and median male earnings in the United States with a correlation coefficient (R) of -0.321 and weighted average of $55,712. Similarly, the statistical analysis conducted on geographies consisting of 476,848,141 people shows a weak negative correlation between the proportion of Immigrants from Northern Europe and median male earnings in the United States with a correlation coefficient (R) of -0.283 and weighted average of $64,987, a difference of 16.7%.
Median Male Earnings Correlation Summary
| Measurement | Immigrants from Oceania | Immigrants from Northern Europe |
| Minimum | $31,736 | $16,326 |
| Maximum | $78,276 | $196,250 |
| Range | $46,540 | $179,924 |
| Mean | $47,354 | $77,779 |
| Median | $44,818 | $76,341 |
| Interquartile 25% (IQ1) | $39,222 | $55,250 |
| Interquartile 75% (IQ3) | $54,011 | $96,105 |
| Interquartile Range (IQR) | $14,789 | $40,855 |
| Standard Deviation (Sample) | $11,148 | $32,560 |
| Standard Deviation (Population) | $10,961 | $32,233 |
Similar Demographics by Median Male Earnings
Demographics Similar to Immigrants from Oceania by Median Male Earnings
In terms of median male earnings, the demographic groups most similar to Immigrants from Oceania are Swiss ($55,731, a difference of 0.030%), English ($55,747, a difference of 0.060%), Peruvian ($55,659, a difference of 0.10%), Scottish ($55,793, a difference of 0.15%), and Immigrants from Philippines ($55,809, a difference of 0.17%).
| Demographics | Rating | Rank | Median Male Earnings |
| Immigrants | Uganda | 82.4 /100 | #144 | Excellent $56,064 |
| Norwegians | 80.9 /100 | #145 | Excellent $55,965 |
| Immigrants | Chile | 80.7 /100 | #146 | Excellent $55,954 |
| Immigrants | Philippines | 78.4 /100 | #147 | Good $55,809 |
| Scottish | 78.2 /100 | #148 | Good $55,793 |
| English | 77.4 /100 | #149 | Good $55,747 |
| Swiss | 77.1 /100 | #150 | Good $55,731 |
| Immigrants | Oceania | 76.8 /100 | #151 | Good $55,712 |
| Peruvians | 75.8 /100 | #152 | Good $55,659 |
| Immigrants | Nepal | 75.0 /100 | #153 | Good $55,615 |
| Taiwanese | 73.9 /100 | #154 | Good $55,556 |
| Scandinavians | 73.4 /100 | #155 | Good $55,527 |
| Immigrants | Ethiopia | 71.6 /100 | #156 | Good $55,434 |
| Icelanders | 71.2 /100 | #157 | Good $55,415 |
| Czechoslovakians | 70.5 /100 | #158 | Good $55,382 |
Demographics Similar to Immigrants from Northern Europe by Median Male Earnings
In terms of median male earnings, the demographic groups most similar to Immigrants from Northern Europe are Immigrants from Korea ($65,079, a difference of 0.14%), Burmese ($65,236, a difference of 0.38%), Immigrants from Denmark ($64,625, a difference of 0.56%), Immigrants from Sweden ($65,406, a difference of 0.65%), and Immigrants from Japan ($65,518, a difference of 0.82%).
| Demographics | Rating | Rank | Median Male Earnings |
| Immigrants | Belgium | 100.0 /100 | #17 | Exceptional $66,125 |
| Indians (Asian) | 100.0 /100 | #18 | Exceptional $66,078 |
| Cypriots | 100.0 /100 | #19 | Exceptional $65,549 |
| Immigrants | Japan | 100.0 /100 | #20 | Exceptional $65,518 |
| Immigrants | Sweden | 100.0 /100 | #21 | Exceptional $65,406 |
| Burmese | 100.0 /100 | #22 | Exceptional $65,236 |
| Immigrants | Korea | 100.0 /100 | #23 | Exceptional $65,079 |
| Immigrants | Northern Europe | 100.0 /100 | #24 | Exceptional $64,987 |
| Immigrants | Denmark | 100.0 /100 | #25 | Exceptional $64,625 |
| Turks | 100.0 /100 | #26 | Exceptional $64,253 |
| Immigrants | Switzerland | 100.0 /100 | #27 | Exceptional $63,944 |
| Russians | 100.0 /100 | #28 | Exceptional $63,939 |
| Asians | 100.0 /100 | #29 | Exceptional $63,827 |
| Immigrants | France | 100.0 /100 | #30 | Exceptional $63,715 |
| Latvians | 100.0 /100 | #31 | Exceptional $63,498 |