Icelander vs Immigrants from Dominican Republic Median Family Income
COMPARE
Icelander
Immigrants from Dominican Republic
Median Family Income
Median Family Income Comparison
Icelanders
Immigrants from Dominican Republic
$104,282
MEDIAN FAMILY INCOME
69.4/ 100
METRIC RATING
161st/ 347
METRIC RANK
$81,233
MEDIAN FAMILY INCOME
0.0/ 100
METRIC RATING
331st/ 347
METRIC RANK
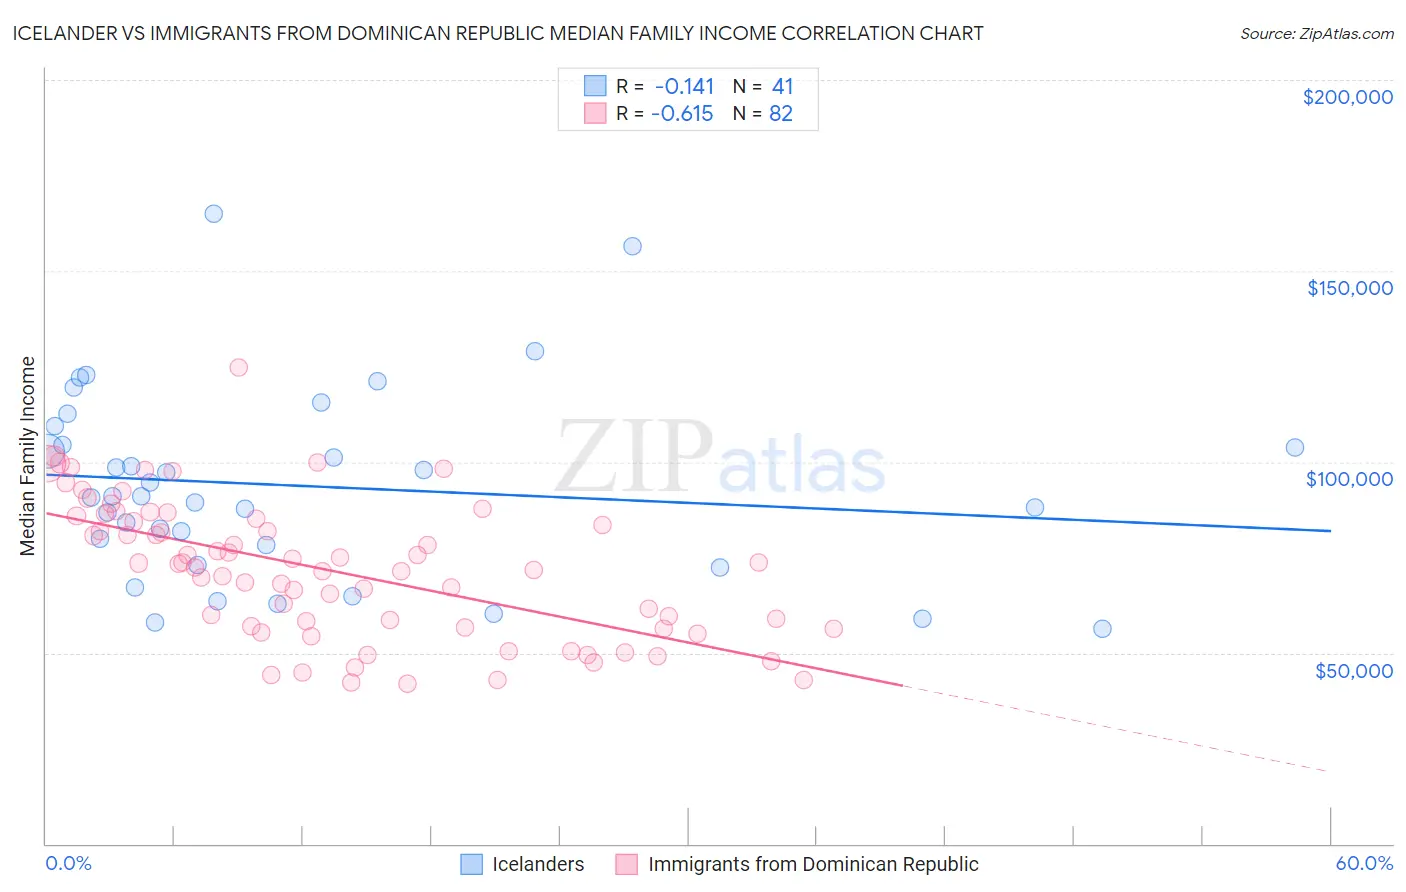
Icelander vs Immigrants from Dominican Republic Median Family Income Correlation Chart
The statistical analysis conducted on geographies consisting of 159,597,543 people shows a poor negative correlation between the proportion of Icelanders and median family income in the United States with a correlation coefficient (R) of -0.141 and weighted average of $104,282. Similarly, the statistical analysis conducted on geographies consisting of 274,877,743 people shows a significant negative correlation between the proportion of Immigrants from Dominican Republic and median family income in the United States with a correlation coefficient (R) of -0.615 and weighted average of $81,233, a difference of 28.4%.
Median Family Income Correlation Summary
| Measurement | Icelander | Immigrants from Dominican Republic |
| Minimum | $56,250 | $41,996 |
| Maximum | $165,003 | $124,734 |
| Range | $108,753 | $82,738 |
| Mean | $93,671 | $71,698 |
| Median | $90,899 | $72,932 |
| Interquartile 25% (IQ1) | $75,543 | $56,743 |
| Interquartile 75% (IQ3) | $106,880 | $84,954 |
| Interquartile Range (IQR) | $31,337 | $28,211 |
| Standard Deviation (Sample) | $25,058 | $17,899 |
| Standard Deviation (Population) | $24,750 | $17,789 |
Similar Demographics by Median Family Income
Demographics Similar to Icelanders by Median Family Income
In terms of median family income, the demographic groups most similar to Icelanders are Scottish ($104,288, a difference of 0.010%), Swiss ($104,396, a difference of 0.11%), Scandinavian ($104,410, a difference of 0.12%), Moroccan ($104,488, a difference of 0.20%), and Immigrants from Sierra Leone ($103,990, a difference of 0.28%).
| Demographics | Rating | Rank | Median Family Income |
| Immigrants | Nepal | 76.3 /100 | #154 | Good $104,966 |
| Native Hawaiians | 75.8 /100 | #155 | Good $104,910 |
| Basques | 74.4 /100 | #156 | Good $104,760 |
| Moroccans | 71.6 /100 | #157 | Good $104,488 |
| Scandinavians | 70.8 /100 | #158 | Good $104,410 |
| Swiss | 70.7 /100 | #159 | Good $104,396 |
| Scottish | 69.5 /100 | #160 | Good $104,288 |
| Icelanders | 69.4 /100 | #161 | Good $104,282 |
| Immigrants | Sierra Leone | 66.2 /100 | #162 | Good $103,990 |
| Costa Ricans | 66.2 /100 | #163 | Good $103,989 |
| Sierra Leoneans | 64.7 /100 | #164 | Good $103,859 |
| Slovaks | 63.1 /100 | #165 | Good $103,729 |
| English | 62.6 /100 | #166 | Good $103,684 |
| South American Indians | 61.9 /100 | #167 | Good $103,624 |
| Immigrants | Peru | 60.8 /100 | #168 | Good $103,534 |
Demographics Similar to Immigrants from Dominican Republic by Median Family Income
In terms of median family income, the demographic groups most similar to Immigrants from Dominican Republic are Cheyenne ($81,385, a difference of 0.19%), Native/Alaskan ($80,908, a difference of 0.40%), Kiowa ($80,885, a difference of 0.43%), Dutch West Indian ($81,852, a difference of 0.76%), and Black/African American ($81,912, a difference of 0.84%).
| Demographics | Rating | Rank | Median Family Income |
| Creek | 0.0 /100 | #324 | Tragic $82,560 |
| Sioux | 0.0 /100 | #325 | Tragic $82,386 |
| Immigrants | Congo | 0.0 /100 | #326 | Tragic $82,216 |
| Arapaho | 0.0 /100 | #327 | Tragic $82,064 |
| Blacks/African Americans | 0.0 /100 | #328 | Tragic $81,912 |
| Dutch West Indians | 0.0 /100 | #329 | Tragic $81,852 |
| Cheyenne | 0.0 /100 | #330 | Tragic $81,385 |
| Immigrants | Dominican Republic | 0.0 /100 | #331 | Tragic $81,233 |
| Natives/Alaskans | 0.0 /100 | #332 | Tragic $80,908 |
| Kiowa | 0.0 /100 | #333 | Tragic $80,885 |
| Menominee | 0.0 /100 | #334 | Tragic $79,563 |
| Yup'ik | 0.0 /100 | #335 | Tragic $79,290 |
| Immigrants | Cuba | 0.0 /100 | #336 | Tragic $78,249 |
| Yuman | 0.0 /100 | #337 | Tragic $78,055 |
| Immigrants | Yemen | 0.0 /100 | #338 | Tragic $77,457 |