Bulgarian vs Thai Median Family Income
COMPARE
Bulgarian
Thai
Median Family Income
Median Family Income Comparison
Bulgarians
Thais
$117,818
MEDIAN FAMILY INCOME
100.0/ 100
METRIC RATING
43rd/ 347
METRIC RANK
$131,281
MEDIAN FAMILY INCOME
100.0/ 100
METRIC RATING
6th/ 347
METRIC RANK
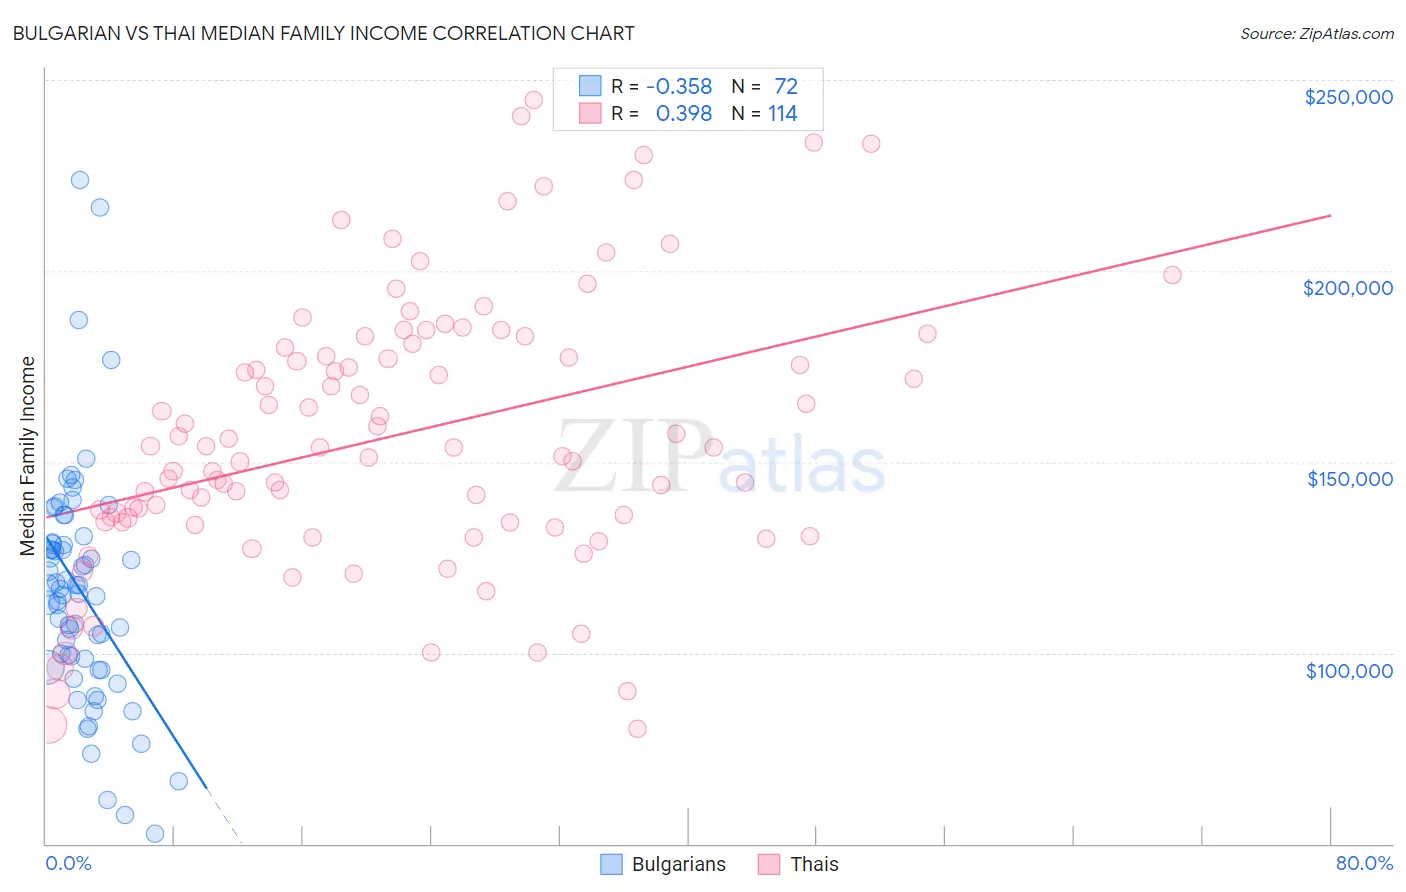
Bulgarian vs Thai Median Family Income Correlation Chart
The statistical analysis conducted on geographies consisting of 205,529,266 people shows a mild negative correlation between the proportion of Bulgarians and median family income in the United States with a correlation coefficient (R) of -0.358 and weighted average of $117,818. Similarly, the statistical analysis conducted on geographies consisting of 475,139,998 people shows a mild positive correlation between the proportion of Thais and median family income in the United States with a correlation coefficient (R) of 0.398 and weighted average of $131,281, a difference of 11.4%.
Median Family Income Correlation Summary
| Measurement | Bulgarian | Thai |
| Minimum | $52,778 | $80,156 |
| Maximum | $223,917 | $244,604 |
| Range | $171,139 | $164,448 |
| Mean | $116,110 | $156,697 |
| Median | $116,274 | $153,787 |
| Interquartile 25% (IQ1) | $97,368 | $134,216 |
| Interquartile 75% (IQ3) | $128,713 | $179,995 |
| Interquartile Range (IQR) | $31,345 | $45,779 |
| Standard Deviation (Sample) | $30,846 | $35,454 |
| Standard Deviation (Population) | $30,631 | $35,298 |
Similar Demographics by Median Family Income
Demographics Similar to Bulgarians by Median Family Income
In terms of median family income, the demographic groups most similar to Bulgarians are Cambodian ($117,780, a difference of 0.030%), Immigrants from Bolivia ($117,912, a difference of 0.080%), Estonian ($118,013, a difference of 0.17%), Immigrants from Lithuania ($118,053, a difference of 0.20%), and Immigrants from Asia ($118,291, a difference of 0.40%).
| Demographics | Rating | Rank | Median Family Income |
| Israelis | 100.0 /100 | #36 | Exceptional $118,577 |
| Australians | 100.0 /100 | #37 | Exceptional $118,440 |
| Immigrants | Turkey | 100.0 /100 | #38 | Exceptional $118,325 |
| Immigrants | Asia | 100.0 /100 | #39 | Exceptional $118,291 |
| Immigrants | Lithuania | 100.0 /100 | #40 | Exceptional $118,053 |
| Estonians | 100.0 /100 | #41 | Exceptional $118,013 |
| Immigrants | Bolivia | 100.0 /100 | #42 | Exceptional $117,912 |
| Bulgarians | 100.0 /100 | #43 | Exceptional $117,818 |
| Cambodians | 100.0 /100 | #44 | Exceptional $117,780 |
| Immigrants | Greece | 99.9 /100 | #45 | Exceptional $117,344 |
| Immigrants | Russia | 99.9 /100 | #46 | Exceptional $116,942 |
| Immigrants | Austria | 99.9 /100 | #47 | Exceptional $116,830 |
| Immigrants | South Africa | 99.9 /100 | #48 | Exceptional $116,286 |
| Chinese | 99.9 /100 | #49 | Exceptional $116,188 |
| Immigrants | Czechoslovakia | 99.9 /100 | #50 | Exceptional $116,165 |
Demographics Similar to Thais by Median Family Income
In terms of median family income, the demographic groups most similar to Thais are Immigrants from Hong Kong ($131,067, a difference of 0.16%), Immigrants from Iran ($130,894, a difference of 0.30%), Okinawan ($129,979, a difference of 1.0%), Iranian ($133,839, a difference of 1.9%), and Immigrants from India ($134,028, a difference of 2.1%).
| Demographics | Rating | Rank | Median Family Income |
| Filipinos | 100.0 /100 | #1 | Exceptional $138,397 |
| Immigrants | Taiwan | 100.0 /100 | #2 | Exceptional $136,949 |
| Immigrants | Singapore | 100.0 /100 | #3 | Exceptional $134,818 |
| Immigrants | India | 100.0 /100 | #4 | Exceptional $134,028 |
| Iranians | 100.0 /100 | #5 | Exceptional $133,839 |
| Thais | 100.0 /100 | #6 | Exceptional $131,281 |
| Immigrants | Hong Kong | 100.0 /100 | #7 | Exceptional $131,067 |
| Immigrants | Iran | 100.0 /100 | #8 | Exceptional $130,894 |
| Okinawans | 100.0 /100 | #9 | Exceptional $129,979 |
| Immigrants | Ireland | 100.0 /100 | #10 | Exceptional $127,584 |
| Immigrants | Israel | 100.0 /100 | #11 | Exceptional $127,430 |
| Cypriots | 100.0 /100 | #12 | Exceptional $127,064 |
| Immigrants | Australia | 100.0 /100 | #13 | Exceptional $126,620 |
| Immigrants | South Central Asia | 100.0 /100 | #14 | Exceptional $125,956 |
| Eastern Europeans | 100.0 /100 | #15 | Exceptional $125,546 |