British West Indian vs Immigrants from France Householder Income Over 65 years
COMPARE
British West Indian
Immigrants from France
Householder Income Over 65 years
Householder Income Over 65 years Comparison
British West Indians
Immigrants from France
$51,463
HOUSEHOLDER INCOME OVER 65 YEARS
0.0/ 100
METRIC RATING
322nd/ 347
METRIC RANK
$66,826
HOUSEHOLDER INCOME OVER 65 YEARS
99.8/ 100
METRIC RATING
48th/ 347
METRIC RANK
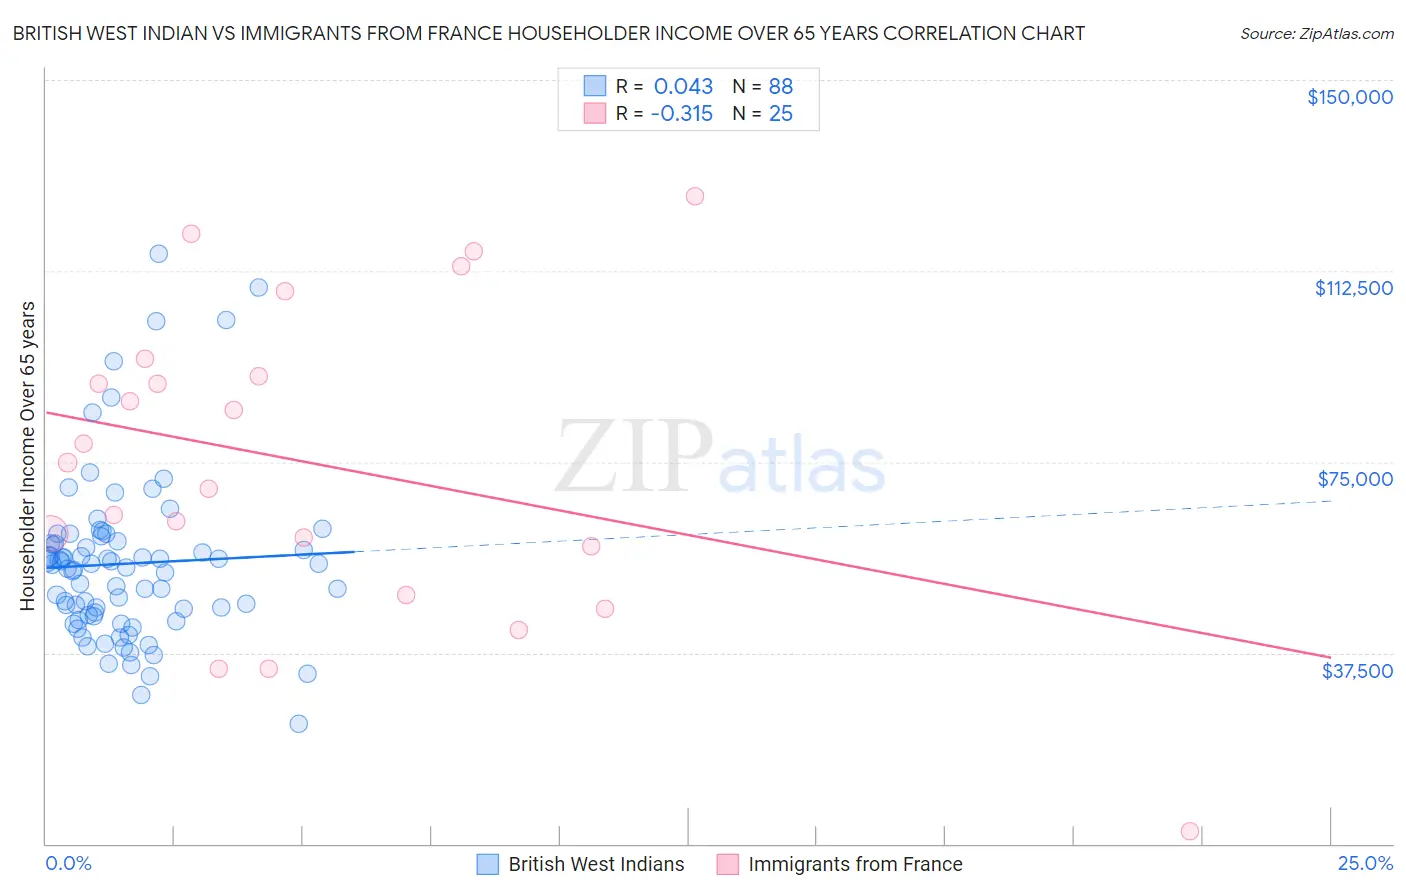
British West Indian vs Immigrants from France Householder Income Over 65 years Correlation Chart
The statistical analysis conducted on geographies consisting of 152,278,159 people shows no correlation between the proportion of British West Indians and household income with householder over the age of 65 in the United States with a correlation coefficient (R) of 0.043 and weighted average of $51,463. Similarly, the statistical analysis conducted on geographies consisting of 287,399,061 people shows a mild negative correlation between the proportion of Immigrants from France and household income with householder over the age of 65 in the United States with a correlation coefficient (R) of -0.315 and weighted average of $66,826, a difference of 29.8%.
Householder Income Over 65 years Correlation Summary
| Measurement | British West Indian | Immigrants from France |
| Minimum | $23,659 | $2,499 |
| Maximum | $115,893 | $127,250 |
| Range | $92,234 | $124,751 |
| Mean | $54,999 | $74,550 |
| Median | $54,565 | $74,828 |
| Interquartile 25% (IQ1) | $44,759 | $53,594 |
| Interquartile 75% (IQ3) | $59,250 | $93,532 |
| Interquartile Range (IQR) | $14,491 | $39,938 |
| Standard Deviation (Sample) | $16,629 | $30,676 |
| Standard Deviation (Population) | $16,534 | $30,056 |
Similar Demographics by Householder Income Over 65 years
Demographics Similar to British West Indians by Householder Income Over 65 years
In terms of householder income over 65 years, the demographic groups most similar to British West Indians are Cajun ($51,397, a difference of 0.13%), Immigrants from Congo ($51,393, a difference of 0.13%), Immigrants from Haiti ($51,219, a difference of 0.47%), Menominee ($51,719, a difference of 0.50%), and Colville ($51,739, a difference of 0.54%).
| Demographics | Rating | Rank | Householder Income Over 65 years |
| U.S. Virgin Islanders | 0.0 /100 | #315 | Tragic $52,072 |
| Creek | 0.0 /100 | #316 | Tragic $51,949 |
| Immigrants | St. Vincent and the Grenadines | 0.0 /100 | #317 | Tragic $51,922 |
| Haitians | 0.0 /100 | #318 | Tragic $51,912 |
| Immigrants | Honduras | 0.0 /100 | #319 | Tragic $51,888 |
| Colville | 0.0 /100 | #320 | Tragic $51,739 |
| Menominee | 0.0 /100 | #321 | Tragic $51,719 |
| British West Indians | 0.0 /100 | #322 | Tragic $51,463 |
| Cajuns | 0.0 /100 | #323 | Tragic $51,397 |
| Immigrants | Congo | 0.0 /100 | #324 | Tragic $51,393 |
| Immigrants | Haiti | 0.0 /100 | #325 | Tragic $51,219 |
| Kiowa | 0.0 /100 | #326 | Tragic $51,140 |
| Bahamians | 0.0 /100 | #327 | Tragic $51,000 |
| Hopi | 0.0 /100 | #328 | Tragic $50,925 |
| Blacks/African Americans | 0.0 /100 | #329 | Tragic $50,779 |
Demographics Similar to Immigrants from France by Householder Income Over 65 years
In terms of householder income over 65 years, the demographic groups most similar to Immigrants from France are Cambodian ($66,892, a difference of 0.10%), Australian ($66,891, a difference of 0.10%), Immigrants from Indonesia ($66,694, a difference of 0.20%), Immigrants from Turkey ($66,672, a difference of 0.23%), and Immigrants from Afghanistan ($67,007, a difference of 0.27%).
| Demographics | Rating | Rank | Householder Income Over 65 years |
| Koreans | 99.9 /100 | #41 | Exceptional $67,472 |
| New Zealanders | 99.9 /100 | #42 | Exceptional $67,333 |
| Latvians | 99.9 /100 | #43 | Exceptional $67,326 |
| Immigrants | South Africa | 99.9 /100 | #44 | Exceptional $67,234 |
| Immigrants | Afghanistan | 99.8 /100 | #45 | Exceptional $67,007 |
| Cambodians | 99.8 /100 | #46 | Exceptional $66,892 |
| Australians | 99.8 /100 | #47 | Exceptional $66,891 |
| Immigrants | France | 99.8 /100 | #48 | Exceptional $66,826 |
| Immigrants | Indonesia | 99.8 /100 | #49 | Exceptional $66,694 |
| Immigrants | Turkey | 99.7 /100 | #50 | Exceptional $66,672 |
| Israelis | 99.7 /100 | #51 | Exceptional $66,636 |
| Immigrants | Scotland | 99.7 /100 | #52 | Exceptional $66,620 |
| Immigrants | Pakistan | 99.7 /100 | #53 | Exceptional $66,617 |
| Immigrants | Netherlands | 99.7 /100 | #54 | Exceptional $66,463 |
| Immigrants | Czechoslovakia | 99.7 /100 | #55 | Exceptional $66,376 |