Australian vs Immigrants from France Householder Income Over 65 years
COMPARE
Australian
Immigrants from France
Householder Income Over 65 years
Householder Income Over 65 years Comparison
Australians
Immigrants from France
$66,891
HOUSEHOLDER INCOME OVER 65 YEARS
99.8/ 100
METRIC RATING
47th/ 347
METRIC RANK
$66,826
HOUSEHOLDER INCOME OVER 65 YEARS
99.8/ 100
METRIC RATING
48th/ 347
METRIC RANK
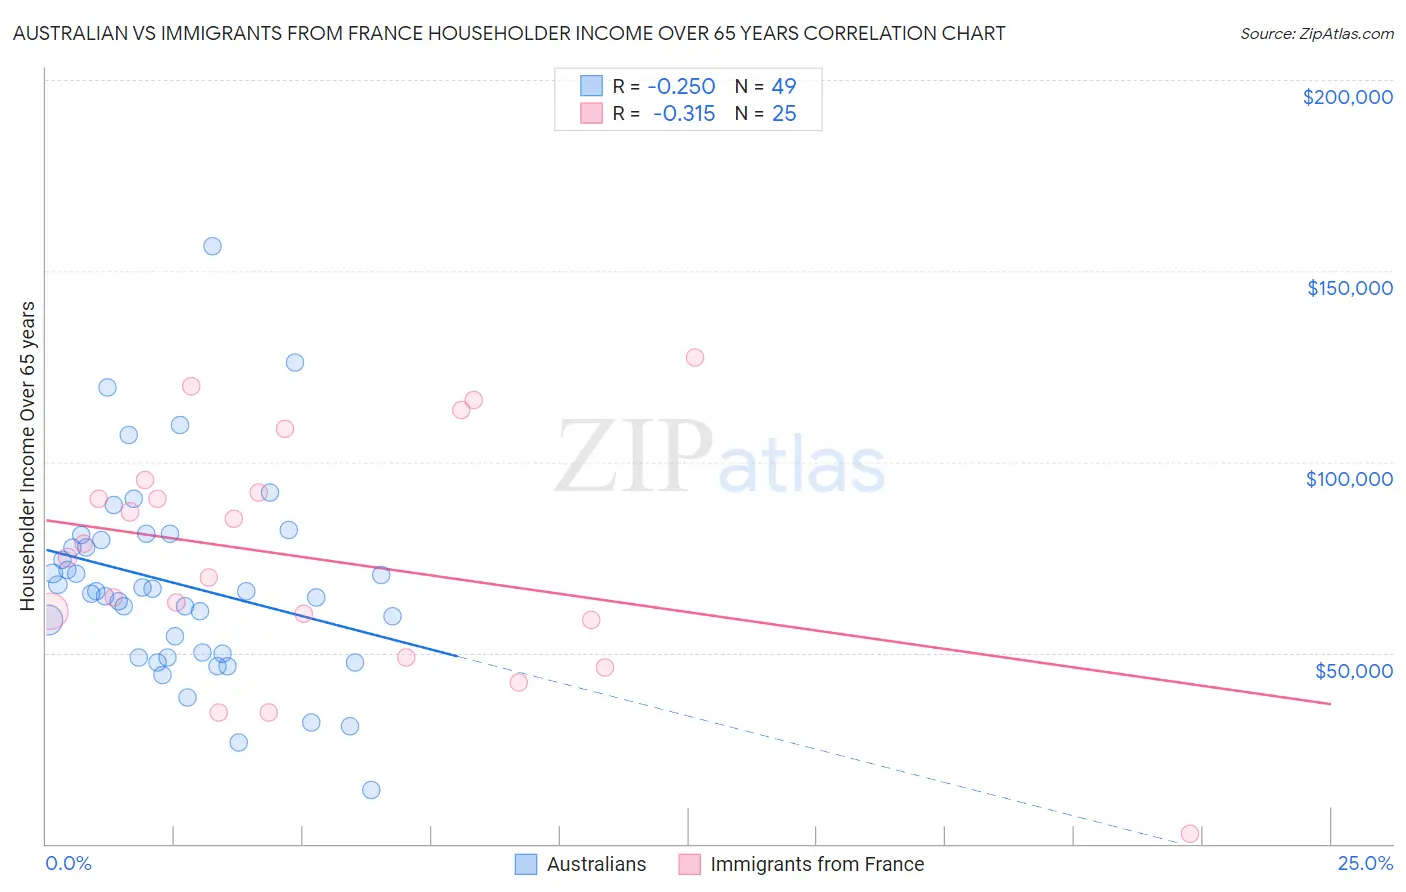
Australian vs Immigrants from France Householder Income Over 65 years Correlation Chart
The statistical analysis conducted on geographies consisting of 223,634,987 people shows a weak negative correlation between the proportion of Australians and household income with householder over the age of 65 in the United States with a correlation coefficient (R) of -0.250 and weighted average of $66,891. Similarly, the statistical analysis conducted on geographies consisting of 287,399,061 people shows a mild negative correlation between the proportion of Immigrants from France and household income with householder over the age of 65 in the United States with a correlation coefficient (R) of -0.315 and weighted average of $66,826, a difference of 0.10%.
Householder Income Over 65 years Correlation Summary
| Measurement | Australian | Immigrants from France |
| Minimum | $13,929 | $2,499 |
| Maximum | $156,341 | $127,250 |
| Range | $142,412 | $124,751 |
| Mean | $67,933 | $74,550 |
| Median | $66,111 | $74,828 |
| Interquartile 25% (IQ1) | $49,254 | $53,594 |
| Interquartile 75% (IQ3) | $80,198 | $93,532 |
| Interquartile Range (IQR) | $30,944 | $39,938 |
| Standard Deviation (Sample) | $25,877 | $30,676 |
| Standard Deviation (Population) | $25,612 | $30,056 |
Demographics Similar to Australians and Immigrants from France by Householder Income Over 65 years
In terms of householder income over 65 years, the demographic groups most similar to Australians are Cambodian ($66,892, a difference of 0.0%), Immigrants from Afghanistan ($67,007, a difference of 0.17%), Immigrants from Indonesia ($66,694, a difference of 0.29%), Immigrants from Turkey ($66,672, a difference of 0.33%), and Israeli ($66,636, a difference of 0.38%). Similarly, the demographic groups most similar to Immigrants from France are Cambodian ($66,892, a difference of 0.10%), Immigrants from Indonesia ($66,694, a difference of 0.20%), Immigrants from Turkey ($66,672, a difference of 0.23%), Immigrants from Afghanistan ($67,007, a difference of 0.27%), and Israeli ($66,636, a difference of 0.29%).
| Demographics | Rating | Rank | Householder Income Over 65 years |
| Turks | 99.9 /100 | #37 | Exceptional $68,037 |
| Estonians | 99.9 /100 | #38 | Exceptional $67,926 |
| Russians | 99.9 /100 | #39 | Exceptional $67,626 |
| Immigrants | Asia | 99.9 /100 | #40 | Exceptional $67,594 |
| Koreans | 99.9 /100 | #41 | Exceptional $67,472 |
| New Zealanders | 99.9 /100 | #42 | Exceptional $67,333 |
| Latvians | 99.9 /100 | #43 | Exceptional $67,326 |
| Immigrants | South Africa | 99.9 /100 | #44 | Exceptional $67,234 |
| Immigrants | Afghanistan | 99.8 /100 | #45 | Exceptional $67,007 |
| Cambodians | 99.8 /100 | #46 | Exceptional $66,892 |
| Australians | 99.8 /100 | #47 | Exceptional $66,891 |
| Immigrants | France | 99.8 /100 | #48 | Exceptional $66,826 |
| Immigrants | Indonesia | 99.8 /100 | #49 | Exceptional $66,694 |
| Immigrants | Turkey | 99.7 /100 | #50 | Exceptional $66,672 |
| Israelis | 99.7 /100 | #51 | Exceptional $66,636 |
| Immigrants | Scotland | 99.7 /100 | #52 | Exceptional $66,620 |
| Immigrants | Pakistan | 99.7 /100 | #53 | Exceptional $66,617 |
| Immigrants | Netherlands | 99.7 /100 | #54 | Exceptional $66,463 |
| Immigrants | Czechoslovakia | 99.7 /100 | #55 | Exceptional $66,376 |
| Laotians | 99.6 /100 | #56 | Exceptional $66,306 |
| Bulgarians | 99.6 /100 | #57 | Exceptional $66,236 |