British West Indian vs Immigrants from Cameroon Householder Income Over 65 years
COMPARE
British West Indian
Immigrants from Cameroon
Householder Income Over 65 years
Householder Income Over 65 years Comparison
British West Indians
Immigrants from Cameroon
$51,463
HOUSEHOLDER INCOME OVER 65 YEARS
0.0/ 100
METRIC RATING
322nd/ 347
METRIC RANK
$63,907
HOUSEHOLDER INCOME OVER 65 YEARS
95.6/ 100
METRIC RATING
104th/ 347
METRIC RANK
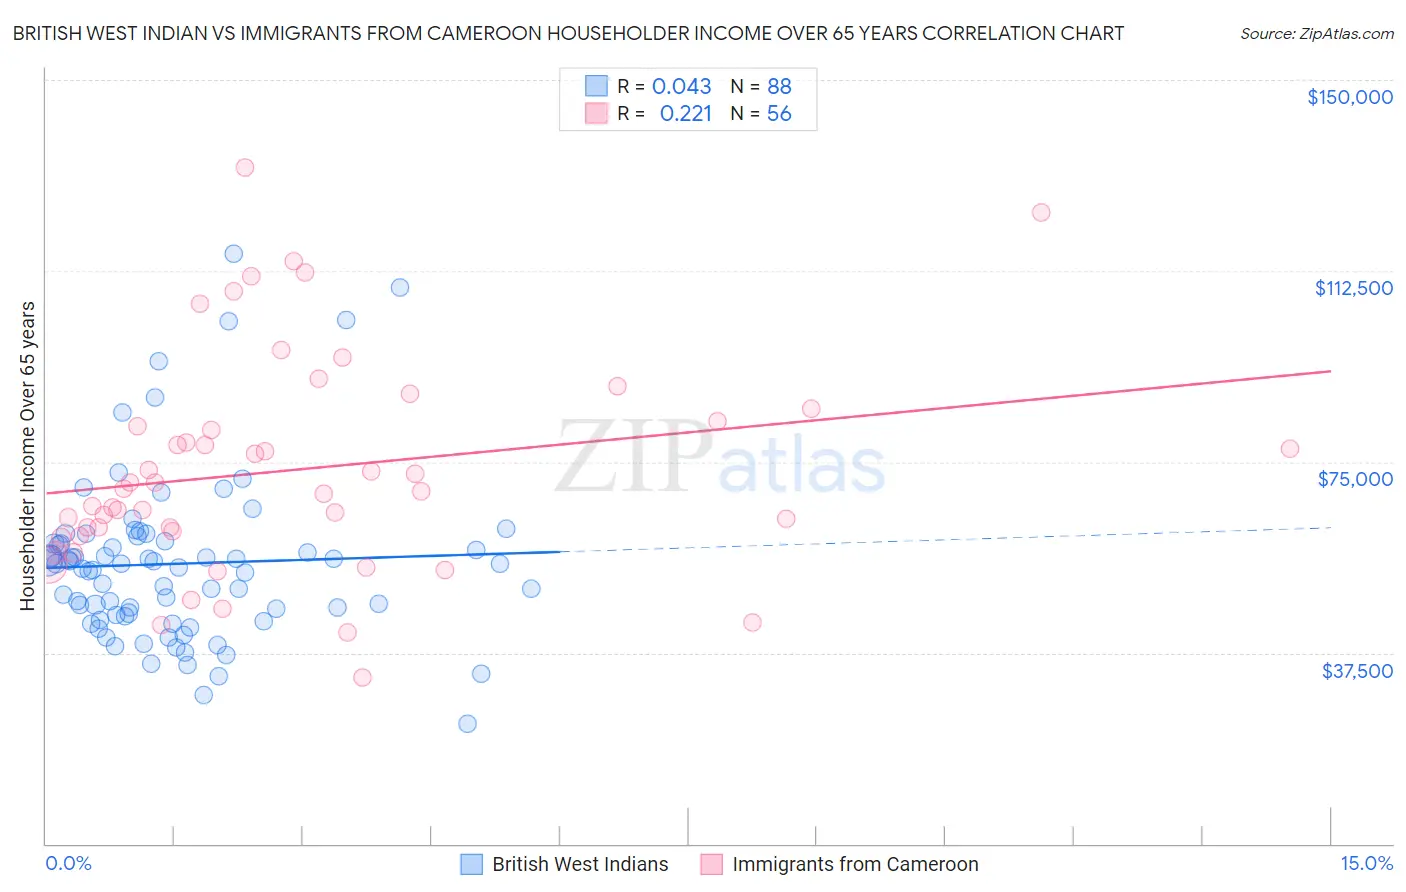
British West Indian vs Immigrants from Cameroon Householder Income Over 65 years Correlation Chart
The statistical analysis conducted on geographies consisting of 152,278,159 people shows no correlation between the proportion of British West Indians and household income with householder over the age of 65 in the United States with a correlation coefficient (R) of 0.043 and weighted average of $51,463. Similarly, the statistical analysis conducted on geographies consisting of 130,525,234 people shows a weak positive correlation between the proportion of Immigrants from Cameroon and household income with householder over the age of 65 in the United States with a correlation coefficient (R) of 0.221 and weighted average of $63,907, a difference of 24.2%.
Householder Income Over 65 years Correlation Summary
| Measurement | British West Indian | Immigrants from Cameroon |
| Minimum | $23,659 | $32,708 |
| Maximum | $115,893 | $132,857 |
| Range | $92,234 | $100,149 |
| Mean | $54,999 | $73,454 |
| Median | $54,565 | $69,536 |
| Interquartile 25% (IQ1) | $44,759 | $60,820 |
| Interquartile 75% (IQ3) | $59,250 | $82,446 |
| Interquartile Range (IQR) | $14,491 | $21,626 |
| Standard Deviation (Sample) | $16,629 | $21,221 |
| Standard Deviation (Population) | $16,534 | $21,031 |
Similar Demographics by Householder Income Over 65 years
Demographics Similar to British West Indians by Householder Income Over 65 years
In terms of householder income over 65 years, the demographic groups most similar to British West Indians are Cajun ($51,397, a difference of 0.13%), Immigrants from Congo ($51,393, a difference of 0.13%), Immigrants from Haiti ($51,219, a difference of 0.47%), Menominee ($51,719, a difference of 0.50%), and Colville ($51,739, a difference of 0.54%).
| Demographics | Rating | Rank | Householder Income Over 65 years |
| U.S. Virgin Islanders | 0.0 /100 | #315 | Tragic $52,072 |
| Creek | 0.0 /100 | #316 | Tragic $51,949 |
| Immigrants | St. Vincent and the Grenadines | 0.0 /100 | #317 | Tragic $51,922 |
| Haitians | 0.0 /100 | #318 | Tragic $51,912 |
| Immigrants | Honduras | 0.0 /100 | #319 | Tragic $51,888 |
| Colville | 0.0 /100 | #320 | Tragic $51,739 |
| Menominee | 0.0 /100 | #321 | Tragic $51,719 |
| British West Indians | 0.0 /100 | #322 | Tragic $51,463 |
| Cajuns | 0.0 /100 | #323 | Tragic $51,397 |
| Immigrants | Congo | 0.0 /100 | #324 | Tragic $51,393 |
| Immigrants | Haiti | 0.0 /100 | #325 | Tragic $51,219 |
| Kiowa | 0.0 /100 | #326 | Tragic $51,140 |
| Bahamians | 0.0 /100 | #327 | Tragic $51,000 |
| Hopi | 0.0 /100 | #328 | Tragic $50,925 |
| Blacks/African Americans | 0.0 /100 | #329 | Tragic $50,779 |
Demographics Similar to Immigrants from Cameroon by Householder Income Over 65 years
In terms of householder income over 65 years, the demographic groups most similar to Immigrants from Cameroon are Italian ($63,885, a difference of 0.030%), Immigrants from Argentina ($63,885, a difference of 0.030%), British ($63,940, a difference of 0.050%), Chilean ($63,957, a difference of 0.080%), and Pakistani ($63,844, a difference of 0.10%).
| Demographics | Rating | Rank | Householder Income Over 65 years |
| Sri Lankans | 96.7 /100 | #97 | Exceptional $64,201 |
| Romanians | 96.5 /100 | #98 | Exceptional $64,142 |
| Assyrians/Chaldeans/Syriacs | 96.4 /100 | #99 | Exceptional $64,108 |
| Immigrants | South Eastern Asia | 96.3 /100 | #100 | Exceptional $64,089 |
| Immigrants | Italy | 96.2 /100 | #101 | Exceptional $64,065 |
| Chileans | 95.8 /100 | #102 | Exceptional $63,957 |
| British | 95.7 /100 | #103 | Exceptional $63,940 |
| Immigrants | Cameroon | 95.6 /100 | #104 | Exceptional $63,907 |
| Italians | 95.5 /100 | #105 | Exceptional $63,885 |
| Immigrants | Argentina | 95.5 /100 | #106 | Exceptional $63,885 |
| Pakistanis | 95.3 /100 | #107 | Exceptional $63,844 |
| Palestinians | 95.1 /100 | #108 | Exceptional $63,800 |
| Europeans | 95.0 /100 | #109 | Exceptional $63,779 |
| Immigrants | Zimbabwe | 94.3 /100 | #110 | Exceptional $63,643 |
| Immigrants | Spain | 93.7 /100 | #111 | Exceptional $63,540 |