British West Indian vs Immigrants from Northern Africa Householder Income Over 65 years
COMPARE
British West Indian
Immigrants from Northern Africa
Householder Income Over 65 years
Householder Income Over 65 years Comparison
British West Indians
Immigrants from Northern Africa
$51,463
HOUSEHOLDER INCOME OVER 65 YEARS
0.0/ 100
METRIC RATING
322nd/ 347
METRIC RANK
$62,522
HOUSEHOLDER INCOME OVER 65 YEARS
83.6/ 100
METRIC RATING
133rd/ 347
METRIC RANK
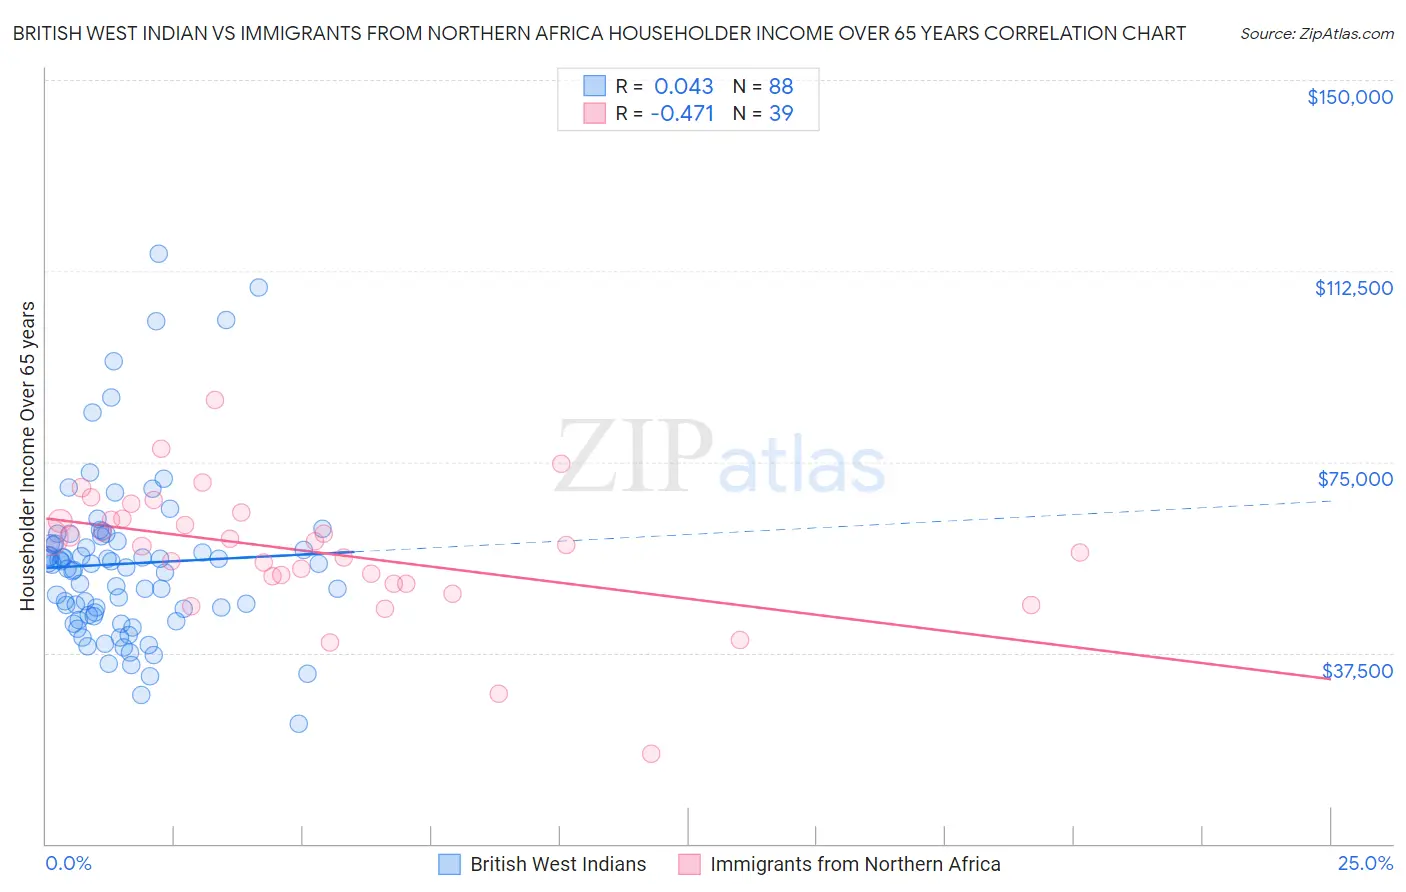
British West Indian vs Immigrants from Northern Africa Householder Income Over 65 years Correlation Chart
The statistical analysis conducted on geographies consisting of 152,278,159 people shows no correlation between the proportion of British West Indians and household income with householder over the age of 65 in the United States with a correlation coefficient (R) of 0.043 and weighted average of $51,463. Similarly, the statistical analysis conducted on geographies consisting of 320,603,488 people shows a moderate negative correlation between the proportion of Immigrants from Northern Africa and household income with householder over the age of 65 in the United States with a correlation coefficient (R) of -0.471 and weighted average of $62,522, a difference of 21.5%.
Householder Income Over 65 years Correlation Summary
| Measurement | British West Indian | Immigrants from Northern Africa |
| Minimum | $23,659 | $17,788 |
| Maximum | $115,893 | $87,122 |
| Range | $92,234 | $69,334 |
| Mean | $54,999 | $57,290 |
| Median | $54,565 | $58,750 |
| Interquartile 25% (IQ1) | $44,759 | $51,125 |
| Interquartile 75% (IQ3) | $59,250 | $63,952 |
| Interquartile Range (IQR) | $14,491 | $12,827 |
| Standard Deviation (Sample) | $16,629 | $12,617 |
| Standard Deviation (Population) | $16,534 | $12,454 |
Similar Demographics by Householder Income Over 65 years
Demographics Similar to British West Indians by Householder Income Over 65 years
In terms of householder income over 65 years, the demographic groups most similar to British West Indians are Cajun ($51,397, a difference of 0.13%), Immigrants from Congo ($51,393, a difference of 0.13%), Immigrants from Haiti ($51,219, a difference of 0.47%), Menominee ($51,719, a difference of 0.50%), and Colville ($51,739, a difference of 0.54%).
| Demographics | Rating | Rank | Householder Income Over 65 years |
| U.S. Virgin Islanders | 0.0 /100 | #315 | Tragic $52,072 |
| Creek | 0.0 /100 | #316 | Tragic $51,949 |
| Immigrants | St. Vincent and the Grenadines | 0.0 /100 | #317 | Tragic $51,922 |
| Haitians | 0.0 /100 | #318 | Tragic $51,912 |
| Immigrants | Honduras | 0.0 /100 | #319 | Tragic $51,888 |
| Colville | 0.0 /100 | #320 | Tragic $51,739 |
| Menominee | 0.0 /100 | #321 | Tragic $51,719 |
| British West Indians | 0.0 /100 | #322 | Tragic $51,463 |
| Cajuns | 0.0 /100 | #323 | Tragic $51,397 |
| Immigrants | Congo | 0.0 /100 | #324 | Tragic $51,393 |
| Immigrants | Haiti | 0.0 /100 | #325 | Tragic $51,219 |
| Kiowa | 0.0 /100 | #326 | Tragic $51,140 |
| Bahamians | 0.0 /100 | #327 | Tragic $51,000 |
| Hopi | 0.0 /100 | #328 | Tragic $50,925 |
| Blacks/African Americans | 0.0 /100 | #329 | Tragic $50,779 |
Demographics Similar to Immigrants from Northern Africa by Householder Income Over 65 years
In terms of householder income over 65 years, the demographic groups most similar to Immigrants from Northern Africa are Immigrants from Germany ($62,544, a difference of 0.040%), Immigrants from Western Asia ($62,645, a difference of 0.20%), Basque ($62,653, a difference of 0.21%), Immigrants from Brazil ($62,364, a difference of 0.25%), and Immigrants from Eastern Europe ($62,693, a difference of 0.27%).
| Demographics | Rating | Rank | Householder Income Over 65 years |
| Peruvians | 86.8 /100 | #126 | Excellent $62,766 |
| Swedes | 86.4 /100 | #127 | Excellent $62,736 |
| Aleuts | 86.1 /100 | #128 | Excellent $62,708 |
| Immigrants | Eastern Europe | 85.9 /100 | #129 | Excellent $62,693 |
| Basques | 85.4 /100 | #130 | Excellent $62,653 |
| Immigrants | Western Asia | 85.3 /100 | #131 | Excellent $62,645 |
| Immigrants | Germany | 83.9 /100 | #132 | Excellent $62,544 |
| Immigrants | Northern Africa | 83.6 /100 | #133 | Excellent $62,522 |
| Immigrants | Brazil | 81.2 /100 | #134 | Excellent $62,364 |
| Immigrants | Chile | 81.0 /100 | #135 | Excellent $62,354 |
| Alaskan Athabascans | 80.6 /100 | #136 | Excellent $62,330 |
| Immigrants | Syria | 80.2 /100 | #137 | Excellent $62,303 |
| Immigrants | Kazakhstan | 80.0 /100 | #138 | Excellent $62,292 |
| Lebanese | 79.9 /100 | #139 | Good $62,287 |
| Arabs | 79.6 /100 | #140 | Good $62,266 |