British West Indian vs Immigrants from Bolivia Householder Income Over 65 years
COMPARE
British West Indian
Immigrants from Bolivia
Householder Income Over 65 years
Householder Income Over 65 years Comparison
British West Indians
Immigrants from Bolivia
$51,463
HOUSEHOLDER INCOME OVER 65 YEARS
0.0/ 100
METRIC RATING
322nd/ 347
METRIC RANK
$73,434
HOUSEHOLDER INCOME OVER 65 YEARS
100.0/ 100
METRIC RATING
7th/ 347
METRIC RANK
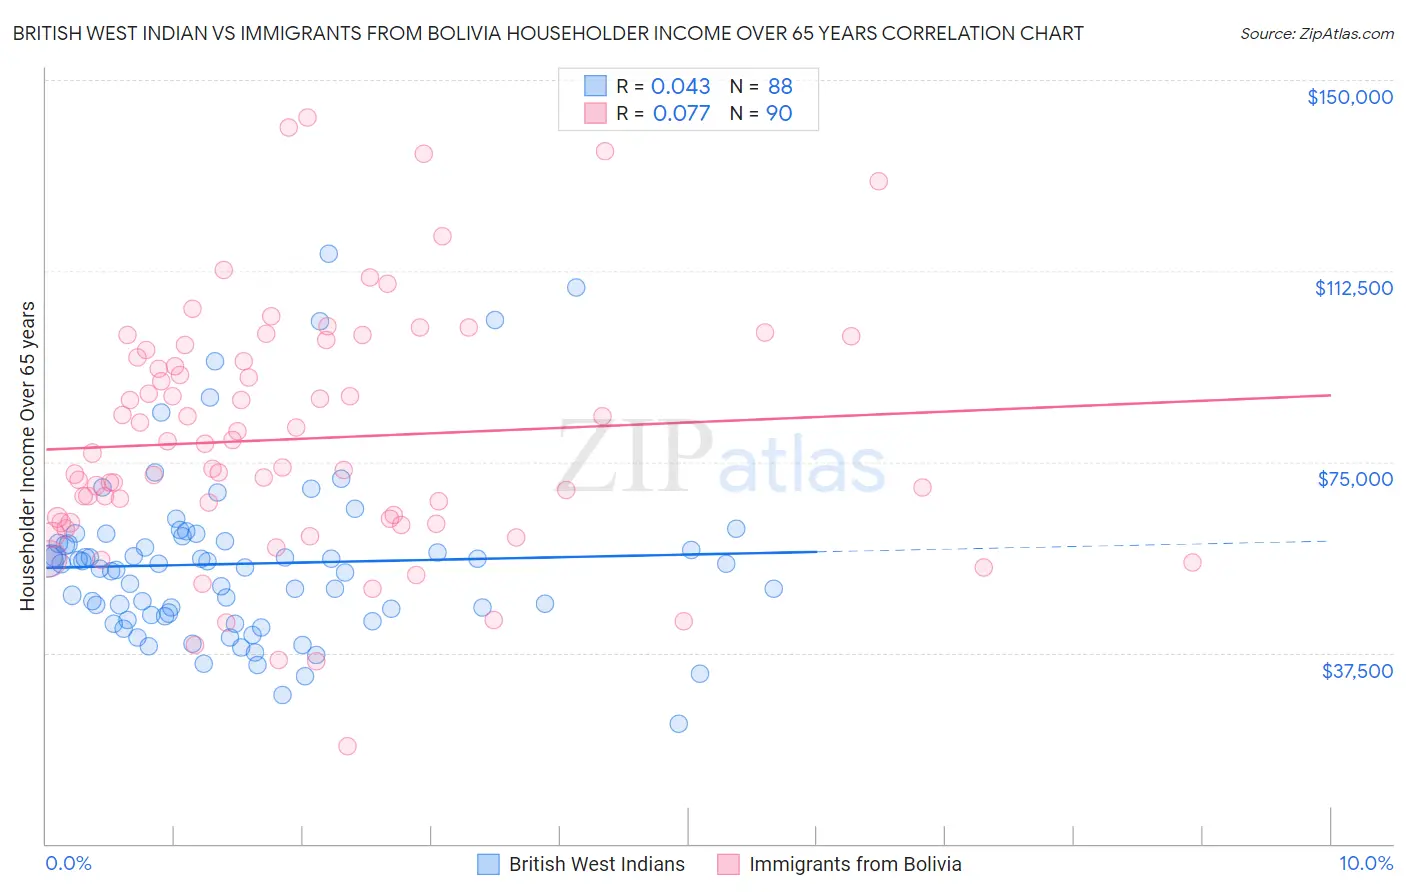
British West Indian vs Immigrants from Bolivia Householder Income Over 65 years Correlation Chart
The statistical analysis conducted on geographies consisting of 152,278,159 people shows no correlation between the proportion of British West Indians and household income with householder over the age of 65 in the United States with a correlation coefficient (R) of 0.043 and weighted average of $51,463. Similarly, the statistical analysis conducted on geographies consisting of 158,593,749 people shows a slight positive correlation between the proportion of Immigrants from Bolivia and household income with householder over the age of 65 in the United States with a correlation coefficient (R) of 0.077 and weighted average of $73,434, a difference of 42.7%.
Householder Income Over 65 years Correlation Summary
| Measurement | British West Indian | Immigrants from Bolivia |
| Minimum | $23,659 | $19,148 |
| Maximum | $115,893 | $142,587 |
| Range | $92,234 | $123,439 |
| Mean | $54,999 | $79,510 |
| Median | $54,565 | $75,276 |
| Interquartile 25% (IQ1) | $44,759 | $63,072 |
| Interquartile 75% (IQ3) | $59,250 | $95,614 |
| Interquartile Range (IQR) | $14,491 | $32,542 |
| Standard Deviation (Sample) | $16,629 | $24,116 |
| Standard Deviation (Population) | $16,534 | $23,982 |
Similar Demographics by Householder Income Over 65 years
Demographics Similar to British West Indians by Householder Income Over 65 years
In terms of householder income over 65 years, the demographic groups most similar to British West Indians are Cajun ($51,397, a difference of 0.13%), Immigrants from Congo ($51,393, a difference of 0.13%), Immigrants from Haiti ($51,219, a difference of 0.47%), Menominee ($51,719, a difference of 0.50%), and Colville ($51,739, a difference of 0.54%).
| Demographics | Rating | Rank | Householder Income Over 65 years |
| U.S. Virgin Islanders | 0.0 /100 | #315 | Tragic $52,072 |
| Creek | 0.0 /100 | #316 | Tragic $51,949 |
| Immigrants | St. Vincent and the Grenadines | 0.0 /100 | #317 | Tragic $51,922 |
| Haitians | 0.0 /100 | #318 | Tragic $51,912 |
| Immigrants | Honduras | 0.0 /100 | #319 | Tragic $51,888 |
| Colville | 0.0 /100 | #320 | Tragic $51,739 |
| Menominee | 0.0 /100 | #321 | Tragic $51,719 |
| British West Indians | 0.0 /100 | #322 | Tragic $51,463 |
| Cajuns | 0.0 /100 | #323 | Tragic $51,397 |
| Immigrants | Congo | 0.0 /100 | #324 | Tragic $51,393 |
| Immigrants | Haiti | 0.0 /100 | #325 | Tragic $51,219 |
| Kiowa | 0.0 /100 | #326 | Tragic $51,140 |
| Bahamians | 0.0 /100 | #327 | Tragic $51,000 |
| Hopi | 0.0 /100 | #328 | Tragic $50,925 |
| Blacks/African Americans | 0.0 /100 | #329 | Tragic $50,779 |
Demographics Similar to Immigrants from Bolivia by Householder Income Over 65 years
In terms of householder income over 65 years, the demographic groups most similar to Immigrants from Bolivia are Immigrants from Singapore ($72,963, a difference of 0.65%), Immigrants from India ($72,804, a difference of 0.87%), Bolivian ($74,245, a difference of 1.1%), Bhutanese ($72,288, a difference of 1.6%), and Thai ($72,099, a difference of 1.8%).
| Demographics | Rating | Rank | Householder Income Over 65 years |
| Chinese | 100.0 /100 | #1 | Exceptional $77,465 |
| Iranians | 100.0 /100 | #2 | Exceptional $77,429 |
| Immigrants | Taiwan | 100.0 /100 | #3 | Exceptional $77,051 |
| Filipinos | 100.0 /100 | #4 | Exceptional $76,686 |
| Immigrants | Iran | 100.0 /100 | #5 | Exceptional $75,081 |
| Bolivians | 100.0 /100 | #6 | Exceptional $74,245 |
| Immigrants | Bolivia | 100.0 /100 | #7 | Exceptional $73,434 |
| Immigrants | Singapore | 100.0 /100 | #8 | Exceptional $72,963 |
| Immigrants | India | 100.0 /100 | #9 | Exceptional $72,804 |
| Bhutanese | 100.0 /100 | #10 | Exceptional $72,288 |
| Thais | 100.0 /100 | #11 | Exceptional $72,099 |
| Cypriots | 100.0 /100 | #12 | Exceptional $71,714 |
| Immigrants | Hong Kong | 100.0 /100 | #13 | Exceptional $71,567 |
| Burmese | 100.0 /100 | #14 | Exceptional $71,139 |
| Native Hawaiians | 100.0 /100 | #15 | Exceptional $71,021 |