British West Indian vs Bermudan Unemployment Among Women with Children Ages 6 to 17 years
COMPARE
British West Indian
Bermudan
Unemployment Among Women with Children Ages 6 to 17 years
Unemployment Among Women with Children Ages 6 to 17 years Comparison
British West Indians
Bermudans
9.7%
UNEMPLOYMENT AMONG WOMEN WITH CHILDREN AGES 6 TO 17 YEARS
0.1/ 100
METRIC RATING
277th/ 347
METRIC RANK
10.5%
UNEMPLOYMENT AMONG WOMEN WITH CHILDREN AGES 6 TO 17 YEARS
0.0/ 100
METRIC RATING
317th/ 347
METRIC RANK
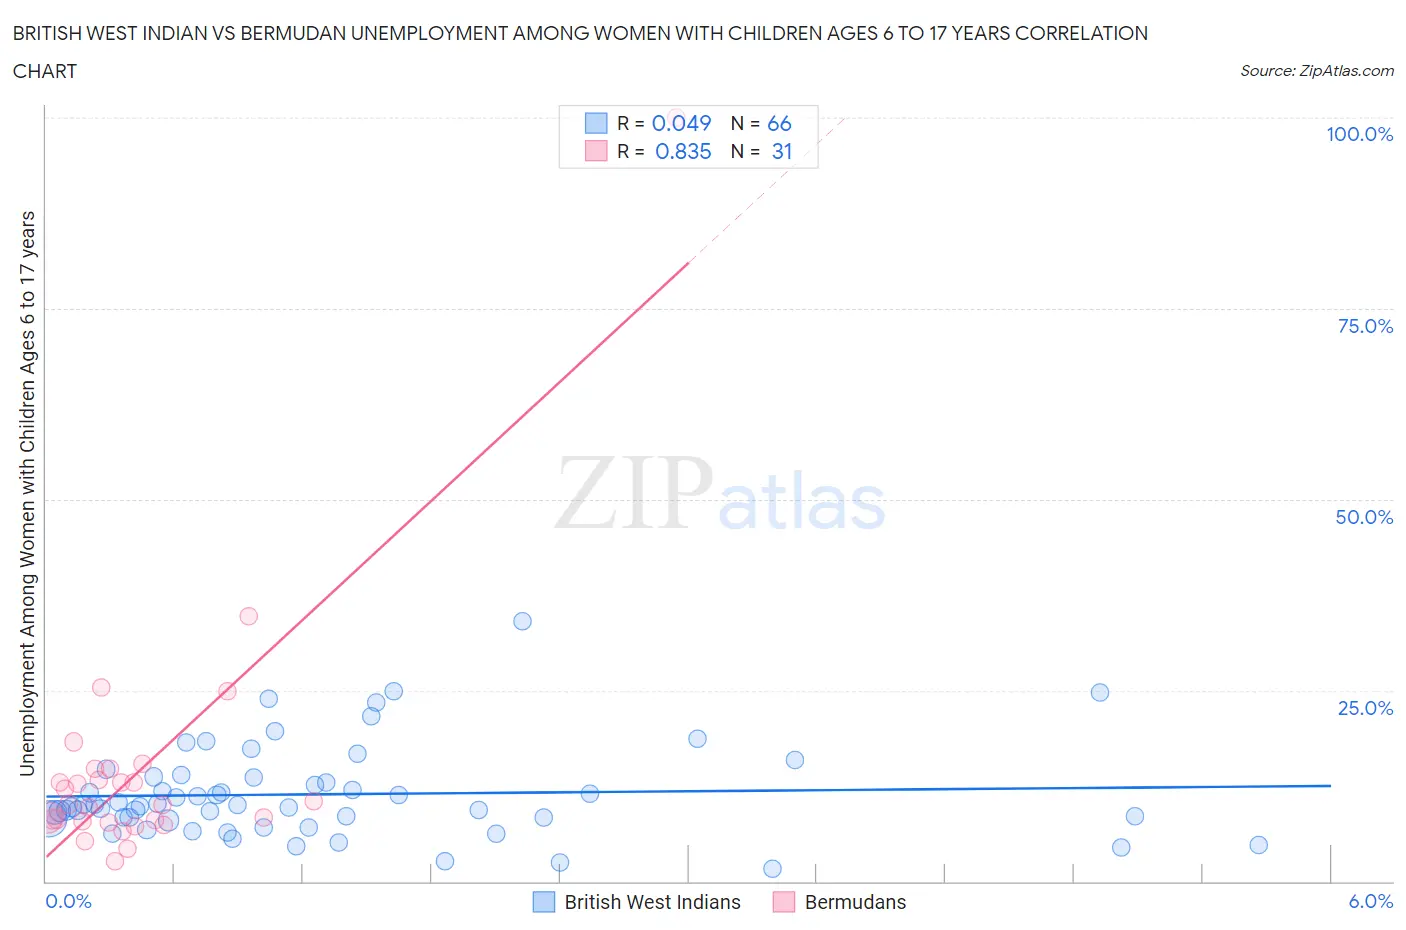
British West Indian vs Bermudan Unemployment Among Women with Children Ages 6 to 17 years Correlation Chart
The statistical analysis conducted on geographies consisting of 128,120,718 people shows no correlation between the proportion of British West Indians and unemployment rate among women with children between the ages 6 and 17 in the United States with a correlation coefficient (R) of 0.049 and weighted average of 9.7%. Similarly, the statistical analysis conducted on geographies consisting of 51,078,380 people shows a very strong positive correlation between the proportion of Bermudans and unemployment rate among women with children between the ages 6 and 17 in the United States with a correlation coefficient (R) of 0.835 and weighted average of 10.5%, a difference of 8.5%.
Unemployment Among Women with Children Ages 6 to 17 years Correlation Summary
| Measurement | British West Indian | Bermudan |
| Minimum | 1.6% | 2.7% |
| Maximum | 34.1% | 100.0% |
| Range | 32.5% | 97.3% |
| Mean | 11.4% | 14.7% |
| Median | 9.9% | 10.1% |
| Interquartile 25% (IQ1) | 8.2% | 7.9% |
| Interquartile 75% (IQ3) | 13.5% | 14.7% |
| Interquartile Range (IQR) | 5.4% | 6.9% |
| Standard Deviation (Sample) | 6.0% | 17.2% |
| Standard Deviation (Population) | 6.0% | 16.9% |
Similar Demographics by Unemployment Among Women with Children Ages 6 to 17 years
Demographics Similar to British West Indians by Unemployment Among Women with Children Ages 6 to 17 years
In terms of unemployment among women with children ages 6 to 17 years, the demographic groups most similar to British West Indians are Immigrants from Portugal (9.7%, a difference of 0.050%), U.S. Virgin Islander (9.7%, a difference of 0.060%), French (9.7%, a difference of 0.070%), Scotch-Irish (9.7%, a difference of 0.11%), and Seminole (9.7%, a difference of 0.29%).
| Demographics | Rating | Rank | Unemployment Among Women with Children Ages 6 to 17 years |
| Immigrants | Nicaragua | 0.2 /100 | #270 | Tragic 9.6% |
| Immigrants | Latin America | 0.1 /100 | #271 | Tragic 9.6% |
| Kiowa | 0.1 /100 | #272 | Tragic 9.6% |
| Whites/Caucasians | 0.1 /100 | #273 | Tragic 9.6% |
| Aleuts | 0.1 /100 | #274 | Tragic 9.6% |
| U.S. Virgin Islanders | 0.1 /100 | #275 | Tragic 9.7% |
| Immigrants | Portugal | 0.1 /100 | #276 | Tragic 9.7% |
| British West Indians | 0.1 /100 | #277 | Tragic 9.7% |
| French | 0.1 /100 | #278 | Tragic 9.7% |
| Scotch-Irish | 0.1 /100 | #279 | Tragic 9.7% |
| Seminole | 0.1 /100 | #280 | Tragic 9.7% |
| Jamaicans | 0.0 /100 | #281 | Tragic 9.8% |
| Slovaks | 0.0 /100 | #282 | Tragic 9.8% |
| Central American Indians | 0.0 /100 | #283 | Tragic 9.9% |
| Yakama | 0.0 /100 | #284 | Tragic 9.9% |
Demographics Similar to Bermudans by Unemployment Among Women with Children Ages 6 to 17 years
In terms of unemployment among women with children ages 6 to 17 years, the demographic groups most similar to Bermudans are Delaware (10.5%, a difference of 0.020%), Immigrants from Dominica (10.5%, a difference of 0.12%), Bahamian (10.4%, a difference of 0.87%), Immigrants from Cabo Verde (10.4%, a difference of 0.89%), and American (10.4%, a difference of 0.94%).
| Demographics | Rating | Rank | Unemployment Among Women with Children Ages 6 to 17 years |
| Alaska Natives | 0.0 /100 | #310 | Tragic 10.3% |
| Immigrants | Liberia | 0.0 /100 | #311 | Tragic 10.3% |
| Africans | 0.0 /100 | #312 | Tragic 10.4% |
| Americans | 0.0 /100 | #313 | Tragic 10.4% |
| Immigrants | Cabo Verde | 0.0 /100 | #314 | Tragic 10.4% |
| Bahamians | 0.0 /100 | #315 | Tragic 10.4% |
| Immigrants | Dominica | 0.0 /100 | #316 | Tragic 10.5% |
| Bermudans | 0.0 /100 | #317 | Tragic 10.5% |
| Delaware | 0.0 /100 | #318 | Tragic 10.5% |
| Immigrants | Uganda | 0.0 /100 | #319 | Tragic 10.7% |
| Apache | 0.0 /100 | #320 | Tragic 10.7% |
| Tohono O'odham | 0.0 /100 | #321 | Tragic 10.7% |
| Cree | 0.0 /100 | #322 | Tragic 10.8% |
| Dominicans | 0.0 /100 | #323 | Tragic 10.8% |
| Immigrants | Dominican Republic | 0.0 /100 | #324 | Tragic 10.8% |