British West Indian vs Portuguese Median Male Earnings
COMPARE
British West Indian
Portuguese
Median Male Earnings
Median Male Earnings Comparison
British West Indians
Portuguese
$49,636
MEDIAN MALE EARNINGS
0.8/ 100
METRIC RATING
257th/ 347
METRIC RANK
$56,663
MEDIAN MALE EARNINGS
89.4/ 100
METRIC RATING
131st/ 347
METRIC RANK
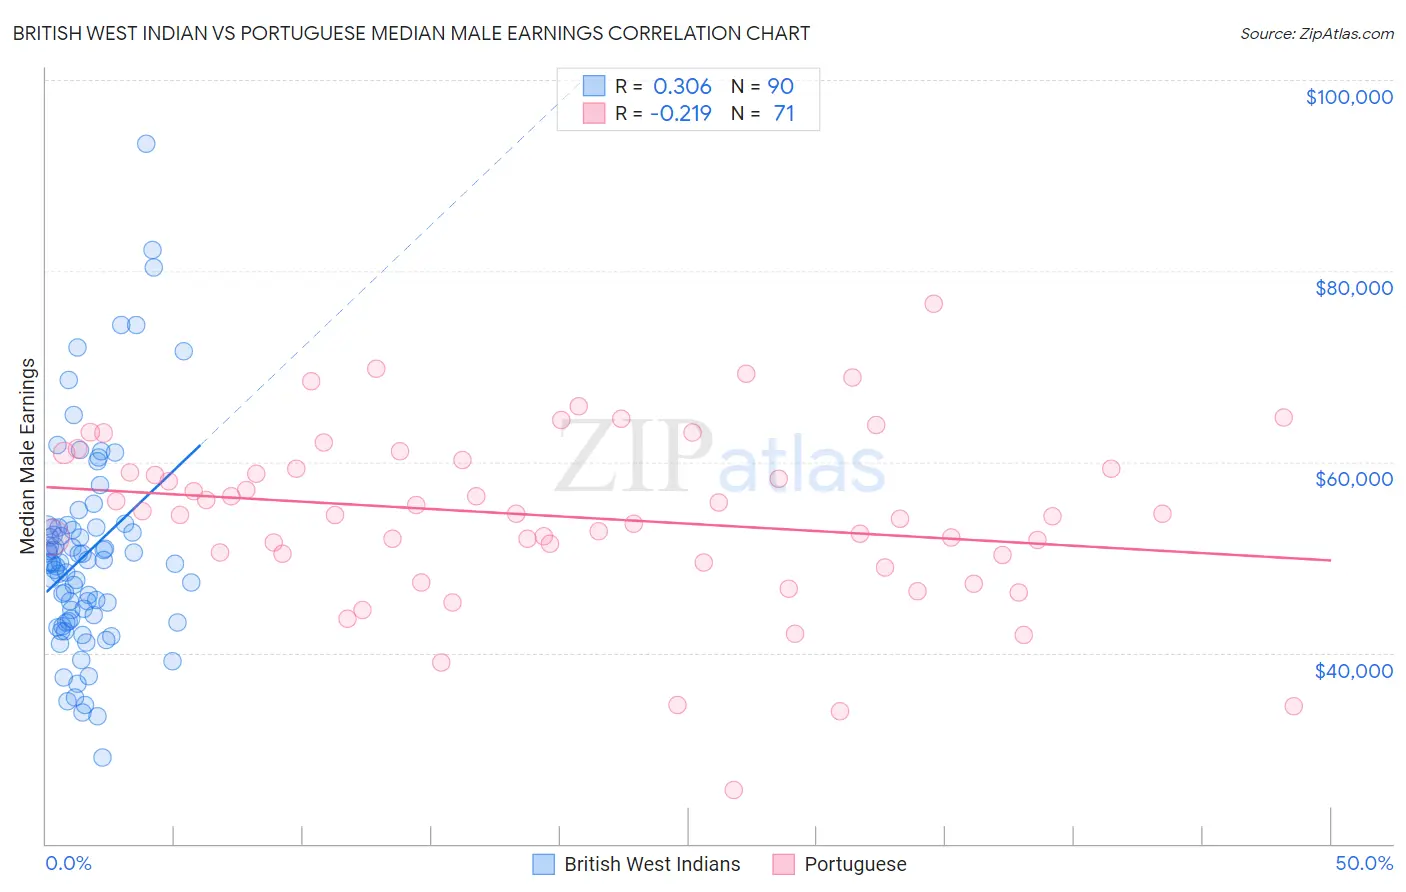
British West Indian vs Portuguese Median Male Earnings Correlation Chart
The statistical analysis conducted on geographies consisting of 152,683,188 people shows a mild positive correlation between the proportion of British West Indians and median male earnings in the United States with a correlation coefficient (R) of 0.306 and weighted average of $49,636. Similarly, the statistical analysis conducted on geographies consisting of 450,078,327 people shows a weak negative correlation between the proportion of Portuguese and median male earnings in the United States with a correlation coefficient (R) of -0.219 and weighted average of $56,663, a difference of 14.2%.
Median Male Earnings Correlation Summary
| Measurement | British West Indian | Portuguese |
| Minimum | $28,979 | $25,598 |
| Maximum | $93,333 | $76,528 |
| Range | $64,354 | $50,930 |
| Mean | $50,358 | $54,293 |
| Median | $49,413 | $54,519 |
| Interquartile 25% (IQ1) | $43,337 | $50,262 |
| Interquartile 75% (IQ3) | $53,079 | $60,181 |
| Interquartile Range (IQR) | $9,742 | $9,919 |
| Standard Deviation (Sample) | $11,060 | $9,132 |
| Standard Deviation (Population) | $10,999 | $9,067 |
Similar Demographics by Median Male Earnings
Demographics Similar to British West Indians by Median Male Earnings
In terms of median male earnings, the demographic groups most similar to British West Indians are Alaska Native ($49,711, a difference of 0.15%), Alaskan Athabascan ($49,748, a difference of 0.23%), Senegalese ($49,774, a difference of 0.28%), Cree ($49,497, a difference of 0.28%), and Nepalese ($49,458, a difference of 0.36%).
| Demographics | Rating | Rank | Median Male Earnings |
| Osage | 1.6 /100 | #250 | Tragic $50,292 |
| Immigrants | Grenada | 1.6 /100 | #251 | Tragic $50,279 |
| Immigrants | Cabo Verde | 1.2 /100 | #252 | Tragic $50,009 |
| German Russians | 1.1 /100 | #253 | Tragic $49,924 |
| Senegalese | 1.0 /100 | #254 | Tragic $49,774 |
| Alaskan Athabascans | 0.9 /100 | #255 | Tragic $49,748 |
| Alaska Natives | 0.9 /100 | #256 | Tragic $49,711 |
| British West Indians | 0.8 /100 | #257 | Tragic $49,636 |
| Cree | 0.7 /100 | #258 | Tragic $49,497 |
| Nepalese | 0.7 /100 | #259 | Tragic $49,458 |
| Iroquois | 0.7 /100 | #260 | Tragic $49,374 |
| Liberians | 0.6 /100 | #261 | Tragic $49,318 |
| Immigrants | West Indies | 0.6 /100 | #262 | Tragic $49,271 |
| Nicaraguans | 0.6 /100 | #263 | Tragic $49,215 |
| Immigrants | Middle Africa | 0.6 /100 | #264 | Tragic $49,201 |
Demographics Similar to Portuguese by Median Male Earnings
In terms of median male earnings, the demographic groups most similar to Portuguese are Korean ($56,672, a difference of 0.020%), Pakistani ($56,719, a difference of 0.10%), Czech ($56,546, a difference of 0.21%), Immigrants from Germany ($56,542, a difference of 0.21%), and Immigrants from Syria ($56,830, a difference of 0.29%).
| Demographics | Rating | Rank | Median Male Earnings |
| Chileans | 91.9 /100 | #124 | Exceptional $56,973 |
| Immigrants | Morocco | 91.8 /100 | #125 | Exceptional $56,958 |
| Chinese | 91.1 /100 | #126 | Exceptional $56,872 |
| Brazilians | 90.9 /100 | #127 | Exceptional $56,837 |
| Immigrants | Syria | 90.8 /100 | #128 | Exceptional $56,830 |
| Pakistanis | 89.9 /100 | #129 | Excellent $56,719 |
| Koreans | 89.4 /100 | #130 | Excellent $56,672 |
| Portuguese | 89.4 /100 | #131 | Excellent $56,663 |
| Czechs | 88.2 /100 | #132 | Excellent $56,546 |
| Immigrants | Germany | 88.2 /100 | #133 | Excellent $56,542 |
| Moroccans | 87.7 /100 | #134 | Excellent $56,499 |
| Irish | 87.4 /100 | #135 | Excellent $56,464 |
| Immigrants | Saudi Arabia | 87.2 /100 | #136 | Excellent $56,452 |
| Slavs | 86.5 /100 | #137 | Excellent $56,390 |
| Slovaks | 85.5 /100 | #138 | Excellent $56,306 |