British West Indian vs Osage Median Male Earnings
COMPARE
British West Indian
Osage
Median Male Earnings
Median Male Earnings Comparison
British West Indians
Osage
$49,636
MEDIAN MALE EARNINGS
0.8/ 100
METRIC RATING
257th/ 347
METRIC RANK
$50,292
MEDIAN MALE EARNINGS
1.6/ 100
METRIC RATING
250th/ 347
METRIC RANK
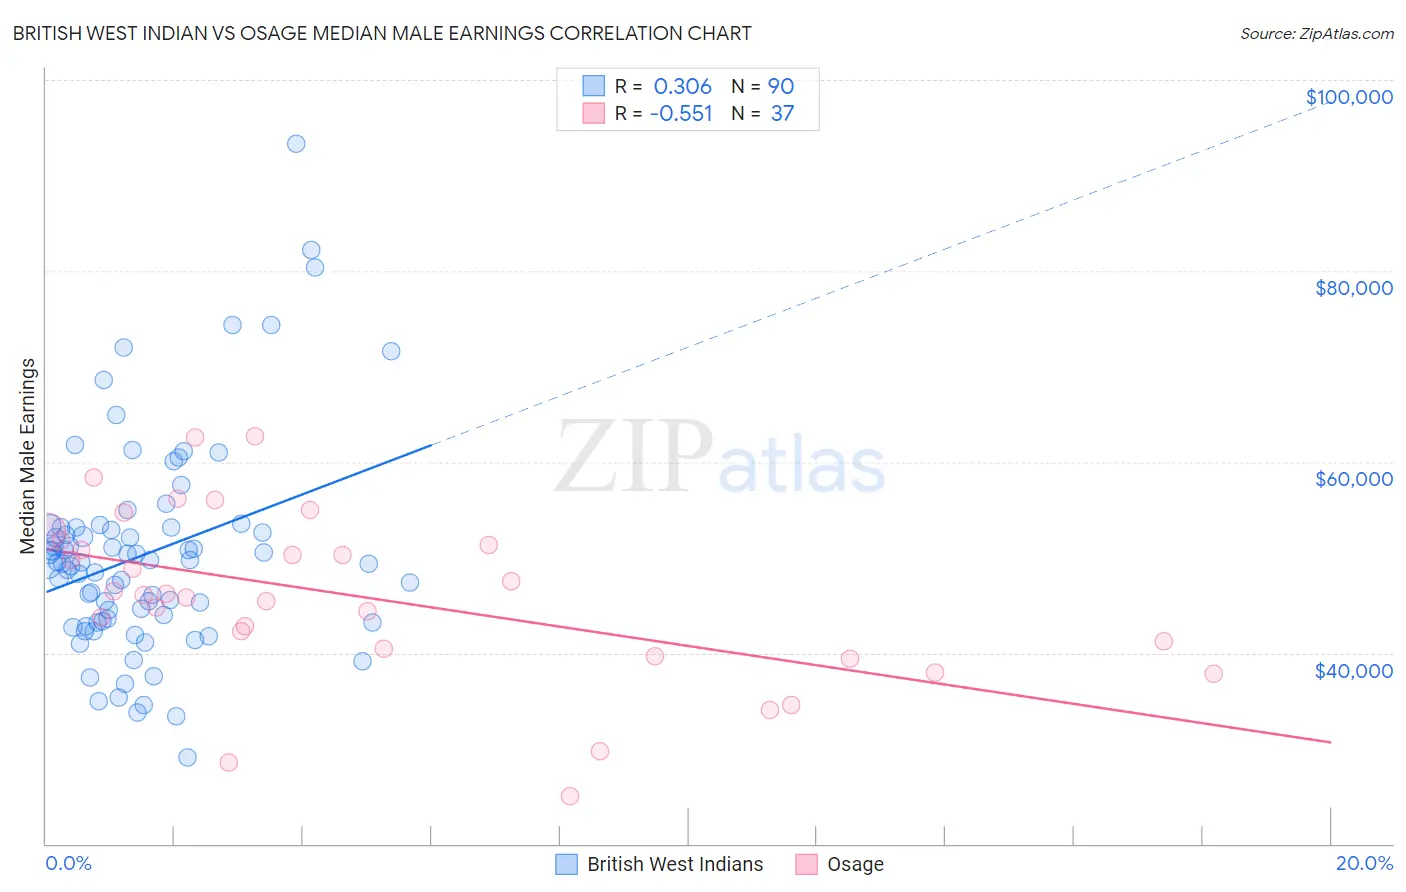
British West Indian vs Osage Median Male Earnings Correlation Chart
The statistical analysis conducted on geographies consisting of 152,683,188 people shows a mild positive correlation between the proportion of British West Indians and median male earnings in the United States with a correlation coefficient (R) of 0.306 and weighted average of $49,636. Similarly, the statistical analysis conducted on geographies consisting of 91,793,042 people shows a substantial negative correlation between the proportion of Osage and median male earnings in the United States with a correlation coefficient (R) of -0.551 and weighted average of $50,292, a difference of 1.3%.
Median Male Earnings Correlation Summary
| Measurement | British West Indian | Osage |
| Minimum | $28,979 | $24,954 |
| Maximum | $93,333 | $62,626 |
| Range | $64,354 | $37,672 |
| Mean | $50,358 | $45,789 |
| Median | $49,413 | $46,052 |
| Interquartile 25% (IQ1) | $43,337 | $40,033 |
| Interquartile 75% (IQ3) | $53,079 | $51,519 |
| Interquartile Range (IQR) | $9,742 | $11,486 |
| Standard Deviation (Sample) | $11,060 | $8,890 |
| Standard Deviation (Population) | $10,999 | $8,769 |
Demographics Similar to British West Indians and Osage by Median Male Earnings
In terms of median male earnings, the demographic groups most similar to British West Indians are Alaska Native ($49,711, a difference of 0.15%), Alaskan Athabascan ($49,748, a difference of 0.23%), Senegalese ($49,774, a difference of 0.28%), Cree ($49,497, a difference of 0.28%), and Nepalese ($49,458, a difference of 0.36%). Similarly, the demographic groups most similar to Osage are Immigrants from Burma/Myanmar ($50,298, a difference of 0.010%), Immigrants from Grenada ($50,279, a difference of 0.020%), Immigrants from Guyana ($50,321, a difference of 0.060%), Subsaharan African ($50,408, a difference of 0.23%), and Immigrants from Ecuador ($50,474, a difference of 0.36%).
| Demographics | Rating | Rank | Median Male Earnings |
| French American Indians | 2.2 /100 | #243 | Tragic $50,611 |
| Houma | 2.0 /100 | #244 | Tragic $50,547 |
| Hawaiians | 1.9 /100 | #245 | Tragic $50,488 |
| Immigrants | Ecuador | 1.9 /100 | #246 | Tragic $50,474 |
| Sub-Saharan Africans | 1.8 /100 | #247 | Tragic $50,408 |
| Immigrants | Guyana | 1.6 /100 | #248 | Tragic $50,321 |
| Immigrants | Burma/Myanmar | 1.6 /100 | #249 | Tragic $50,298 |
| Osage | 1.6 /100 | #250 | Tragic $50,292 |
| Immigrants | Grenada | 1.6 /100 | #251 | Tragic $50,279 |
| Immigrants | Cabo Verde | 1.2 /100 | #252 | Tragic $50,009 |
| German Russians | 1.1 /100 | #253 | Tragic $49,924 |
| Senegalese | 1.0 /100 | #254 | Tragic $49,774 |
| Alaskan Athabascans | 0.9 /100 | #255 | Tragic $49,748 |
| Alaska Natives | 0.9 /100 | #256 | Tragic $49,711 |
| British West Indians | 0.8 /100 | #257 | Tragic $49,636 |
| Cree | 0.7 /100 | #258 | Tragic $49,497 |
| Nepalese | 0.7 /100 | #259 | Tragic $49,458 |
| Iroquois | 0.7 /100 | #260 | Tragic $49,374 |
| Liberians | 0.6 /100 | #261 | Tragic $49,318 |
| Immigrants | West Indies | 0.6 /100 | #262 | Tragic $49,271 |
| Nicaraguans | 0.6 /100 | #263 | Tragic $49,215 |