Bangladeshi vs Ugandan Median Family Income
COMPARE
Bangladeshi
Ugandan
Median Family Income
Median Family Income Comparison
Bangladeshis
Ugandans
$88,358
MEDIAN FAMILY INCOME
0.1/ 100
METRIC RATING
283rd/ 347
METRIC RANK
$106,541
MEDIAN FAMILY INCOME
87.8/ 100
METRIC RATING
133rd/ 347
METRIC RANK
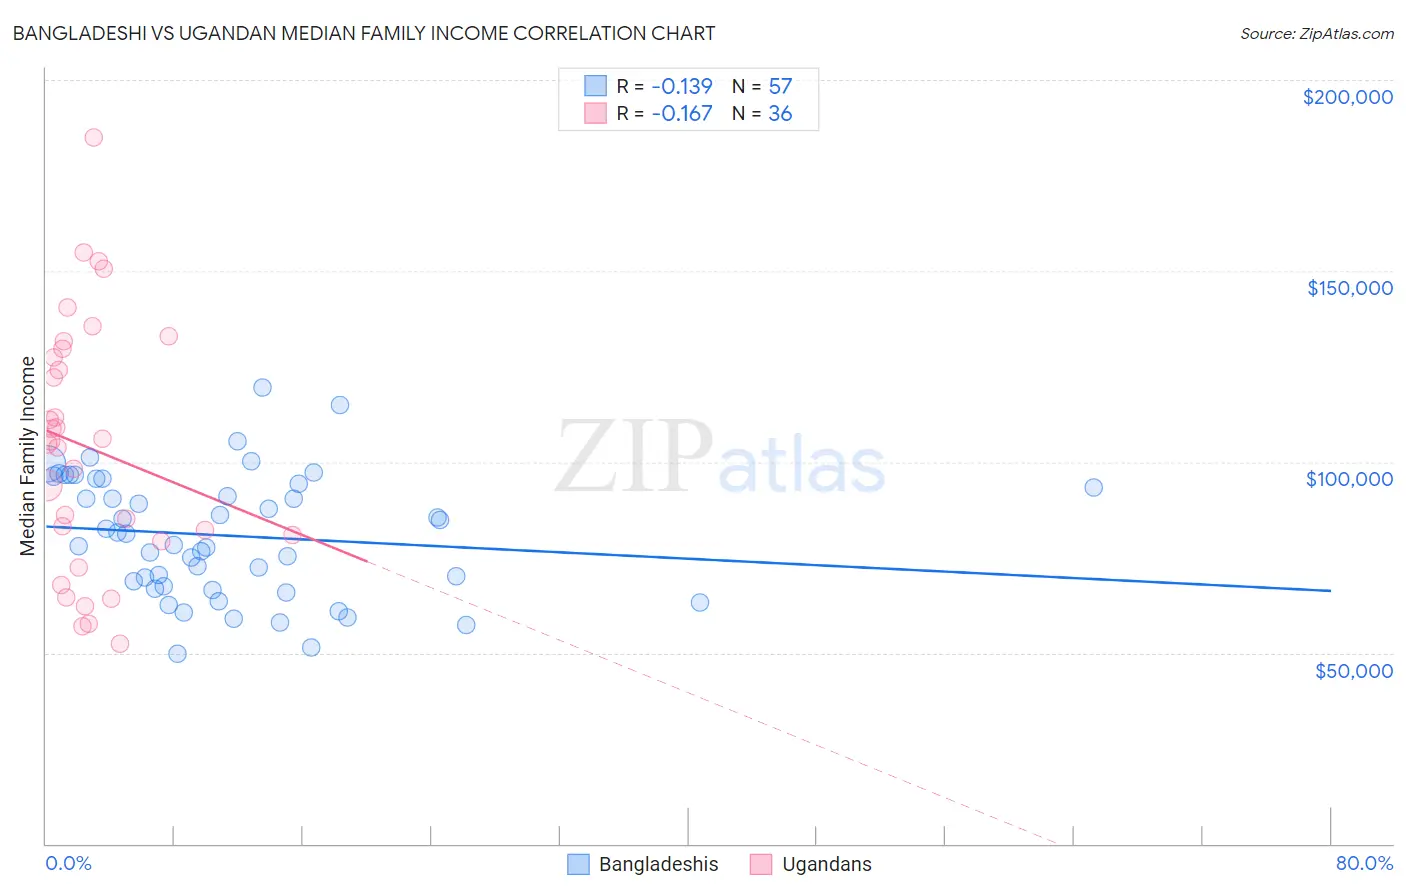
Bangladeshi vs Ugandan Median Family Income Correlation Chart
The statistical analysis conducted on geographies consisting of 141,321,089 people shows a poor negative correlation between the proportion of Bangladeshis and median family income in the United States with a correlation coefficient (R) of -0.139 and weighted average of $88,358. Similarly, the statistical analysis conducted on geographies consisting of 93,987,569 people shows a poor negative correlation between the proportion of Ugandans and median family income in the United States with a correlation coefficient (R) of -0.167 and weighted average of $106,541, a difference of 20.6%.
Median Family Income Correlation Summary
| Measurement | Bangladeshi | Ugandan |
| Minimum | $49,670 | $52,432 |
| Maximum | $119,471 | $184,887 |
| Range | $69,801 | $132,455 |
| Mean | $80,654 | $103,672 |
| Median | $81,226 | $104,959 |
| Interquartile 25% (IQ1) | $67,095 | $79,923 |
| Interquartile 75% (IQ3) | $94,926 | $128,589 |
| Interquartile Range (IQR) | $27,831 | $48,666 |
| Standard Deviation (Sample) | $16,058 | $32,416 |
| Standard Deviation (Population) | $15,916 | $31,963 |
Similar Demographics by Median Family Income
Demographics Similar to Bangladeshis by Median Family Income
In terms of median family income, the demographic groups most similar to Bangladeshis are Indonesian ($88,301, a difference of 0.060%), Guatemalan ($88,295, a difference of 0.070%), Immigrants from Nicaragua ($88,267, a difference of 0.10%), Potawatomi ($88,265, a difference of 0.11%), and Cherokee ($88,209, a difference of 0.17%).
| Demographics | Rating | Rank | Median Family Income |
| Immigrants | Zaire | 0.1 /100 | #276 | Tragic $89,285 |
| Immigrants | Jamaica | 0.1 /100 | #277 | Tragic $89,268 |
| Immigrants | Grenada | 0.1 /100 | #278 | Tragic $89,249 |
| Immigrants | Belize | 0.1 /100 | #279 | Tragic $89,197 |
| British West Indians | 0.1 /100 | #280 | Tragic $88,987 |
| Blackfeet | 0.1 /100 | #281 | Tragic $88,717 |
| Comanche | 0.1 /100 | #282 | Tragic $88,556 |
| Bangladeshis | 0.1 /100 | #283 | Tragic $88,358 |
| Indonesians | 0.1 /100 | #284 | Tragic $88,301 |
| Guatemalans | 0.1 /100 | #285 | Tragic $88,295 |
| Immigrants | Nicaragua | 0.1 /100 | #286 | Tragic $88,267 |
| Potawatomi | 0.1 /100 | #287 | Tragic $88,265 |
| Cherokee | 0.1 /100 | #288 | Tragic $88,209 |
| Central American Indians | 0.1 /100 | #289 | Tragic $88,034 |
| Shoshone | 0.1 /100 | #290 | Tragic $87,872 |
Demographics Similar to Ugandans by Median Family Income
In terms of median family income, the demographic groups most similar to Ugandans are Immigrants from Fiji ($106,544, a difference of 0.0%), Canadian ($106,597, a difference of 0.050%), Immigrants from Oceania ($106,453, a difference of 0.080%), Portuguese ($106,286, a difference of 0.24%), and Immigrants from South Eastern Asia ($106,252, a difference of 0.27%).
| Demographics | Rating | Rank | Median Family Income |
| Serbians | 90.8 /100 | #126 | Exceptional $107,157 |
| Lebanese | 90.5 /100 | #127 | Exceptional $107,086 |
| Immigrants | Ethiopia | 90.0 /100 | #128 | Excellent $106,969 |
| Arabs | 89.9 /100 | #129 | Excellent $106,952 |
| Brazilians | 89.8 /100 | #130 | Excellent $106,942 |
| Canadians | 88.1 /100 | #131 | Excellent $106,597 |
| Immigrants | Fiji | 87.8 /100 | #132 | Excellent $106,544 |
| Ugandans | 87.8 /100 | #133 | Excellent $106,541 |
| Immigrants | Oceania | 87.3 /100 | #134 | Excellent $106,453 |
| Portuguese | 86.3 /100 | #135 | Excellent $106,286 |
| Immigrants | South Eastern Asia | 86.1 /100 | #136 | Excellent $106,252 |
| Immigrants | Uganda | 85.7 /100 | #137 | Excellent $106,188 |
| Immigrants | Vietnam | 85.7 /100 | #138 | Excellent $106,186 |
| Luxembourgers | 85.7 /100 | #139 | Excellent $106,183 |
| Norwegians | 85.5 /100 | #140 | Excellent $106,144 |