Alaskan Athabascan vs Ugandan Median Family Income
COMPARE
Alaskan Athabascan
Ugandan
Median Family Income
Median Family Income Comparison
Alaskan Athabascans
Ugandans
$94,429
MEDIAN FAMILY INCOME
1.5/ 100
METRIC RATING
237th/ 347
METRIC RANK
$106,541
MEDIAN FAMILY INCOME
87.8/ 100
METRIC RATING
133rd/ 347
METRIC RANK
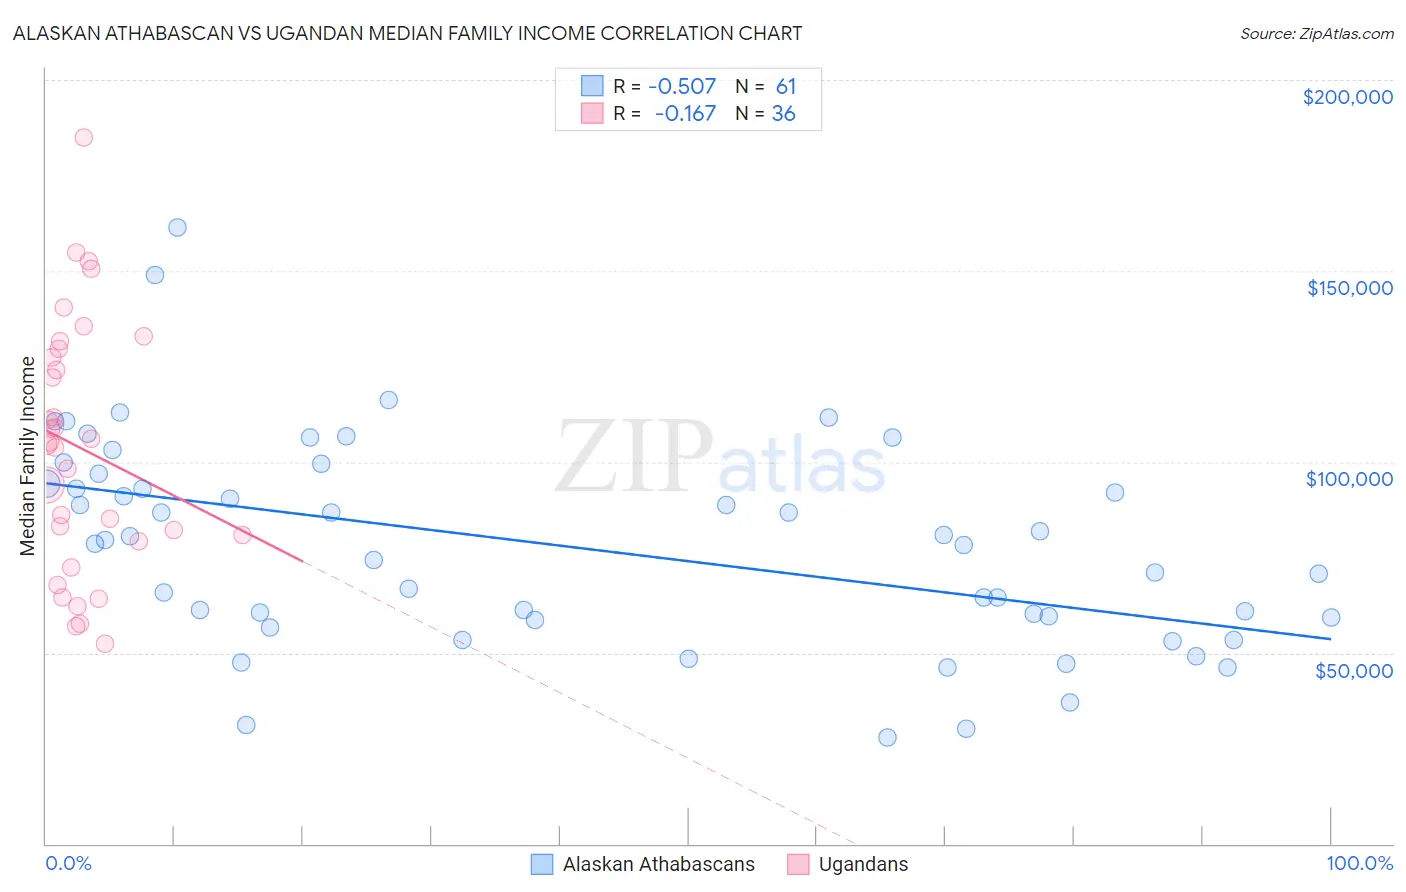
Alaskan Athabascan vs Ugandan Median Family Income Correlation Chart
The statistical analysis conducted on geographies consisting of 45,809,380 people shows a substantial negative correlation between the proportion of Alaskan Athabascans and median family income in the United States with a correlation coefficient (R) of -0.507 and weighted average of $94,429. Similarly, the statistical analysis conducted on geographies consisting of 93,987,569 people shows a poor negative correlation between the proportion of Ugandans and median family income in the United States with a correlation coefficient (R) of -0.167 and weighted average of $106,541, a difference of 12.8%.
Median Family Income Correlation Summary
| Measurement | Alaskan Athabascan | Ugandan |
| Minimum | $27,750 | $52,432 |
| Maximum | $161,458 | $184,887 |
| Range | $133,708 | $132,455 |
| Mean | $77,954 | $103,672 |
| Median | $78,665 | $104,959 |
| Interquartile 25% (IQ1) | $58,765 | $79,923 |
| Interquartile 75% (IQ3) | $95,601 | $128,589 |
| Interquartile Range (IQR) | $36,836 | $48,666 |
| Standard Deviation (Sample) | $27,325 | $32,416 |
| Standard Deviation (Population) | $27,100 | $31,963 |
Similar Demographics by Median Family Income
Demographics Similar to Alaskan Athabascans by Median Family Income
In terms of median family income, the demographic groups most similar to Alaskan Athabascans are Immigrants from Burma/Myanmar ($94,472, a difference of 0.040%), Trinidadian and Tobagonian ($94,466, a difference of 0.040%), Immigrants from Western Africa ($94,638, a difference of 0.22%), Immigrants from Bangladesh ($94,665, a difference of 0.25%), and Nepalese ($94,153, a difference of 0.29%).
| Demographics | Rating | Rank | Median Family Income |
| Malaysians | 2.2 /100 | #230 | Tragic $95,230 |
| Ecuadorians | 2.1 /100 | #231 | Tragic $95,114 |
| Immigrants | Venezuela | 1.9 /100 | #232 | Tragic $94,904 |
| Immigrants | Bangladesh | 1.6 /100 | #233 | Tragic $94,665 |
| Immigrants | Western Africa | 1.6 /100 | #234 | Tragic $94,638 |
| Immigrants | Burma/Myanmar | 1.5 /100 | #235 | Tragic $94,472 |
| Trinidadians and Tobagonians | 1.5 /100 | #236 | Tragic $94,466 |
| Alaskan Athabascans | 1.5 /100 | #237 | Tragic $94,429 |
| Nepalese | 1.3 /100 | #238 | Tragic $94,153 |
| Salvadorans | 1.2 /100 | #239 | Tragic $94,109 |
| Somalis | 1.2 /100 | #240 | Tragic $94,085 |
| Immigrants | Trinidad and Tobago | 1.2 /100 | #241 | Tragic $93,988 |
| Barbadians | 1.1 /100 | #242 | Tragic $93,919 |
| German Russians | 1.1 /100 | #243 | Tragic $93,858 |
| Sub-Saharan Africans | 1.0 /100 | #244 | Tragic $93,748 |
Demographics Similar to Ugandans by Median Family Income
In terms of median family income, the demographic groups most similar to Ugandans are Immigrants from Fiji ($106,544, a difference of 0.0%), Canadian ($106,597, a difference of 0.050%), Immigrants from Oceania ($106,453, a difference of 0.080%), Portuguese ($106,286, a difference of 0.24%), and Immigrants from South Eastern Asia ($106,252, a difference of 0.27%).
| Demographics | Rating | Rank | Median Family Income |
| Serbians | 90.8 /100 | #126 | Exceptional $107,157 |
| Lebanese | 90.5 /100 | #127 | Exceptional $107,086 |
| Immigrants | Ethiopia | 90.0 /100 | #128 | Excellent $106,969 |
| Arabs | 89.9 /100 | #129 | Excellent $106,952 |
| Brazilians | 89.8 /100 | #130 | Excellent $106,942 |
| Canadians | 88.1 /100 | #131 | Excellent $106,597 |
| Immigrants | Fiji | 87.8 /100 | #132 | Excellent $106,544 |
| Ugandans | 87.8 /100 | #133 | Excellent $106,541 |
| Immigrants | Oceania | 87.3 /100 | #134 | Excellent $106,453 |
| Portuguese | 86.3 /100 | #135 | Excellent $106,286 |
| Immigrants | South Eastern Asia | 86.1 /100 | #136 | Excellent $106,252 |
| Immigrants | Uganda | 85.7 /100 | #137 | Excellent $106,188 |
| Immigrants | Vietnam | 85.7 /100 | #138 | Excellent $106,186 |
| Luxembourgers | 85.7 /100 | #139 | Excellent $106,183 |
| Norwegians | 85.5 /100 | #140 | Excellent $106,144 |