British vs Native/Alaskan Wage/Income Gap
COMPARE
British
Native/Alaskan
Wage/Income Gap
Wage/Income Gap Comparison
British
Natives/Alaskans
28.9%
WAGE/INCOME GAP
0.1/ 100
METRIC RATING
320th/ 347
METRIC RANK
24.6%
WAGE/INCOME GAP
94.6/ 100
METRIC RATING
123rd/ 347
METRIC RANK
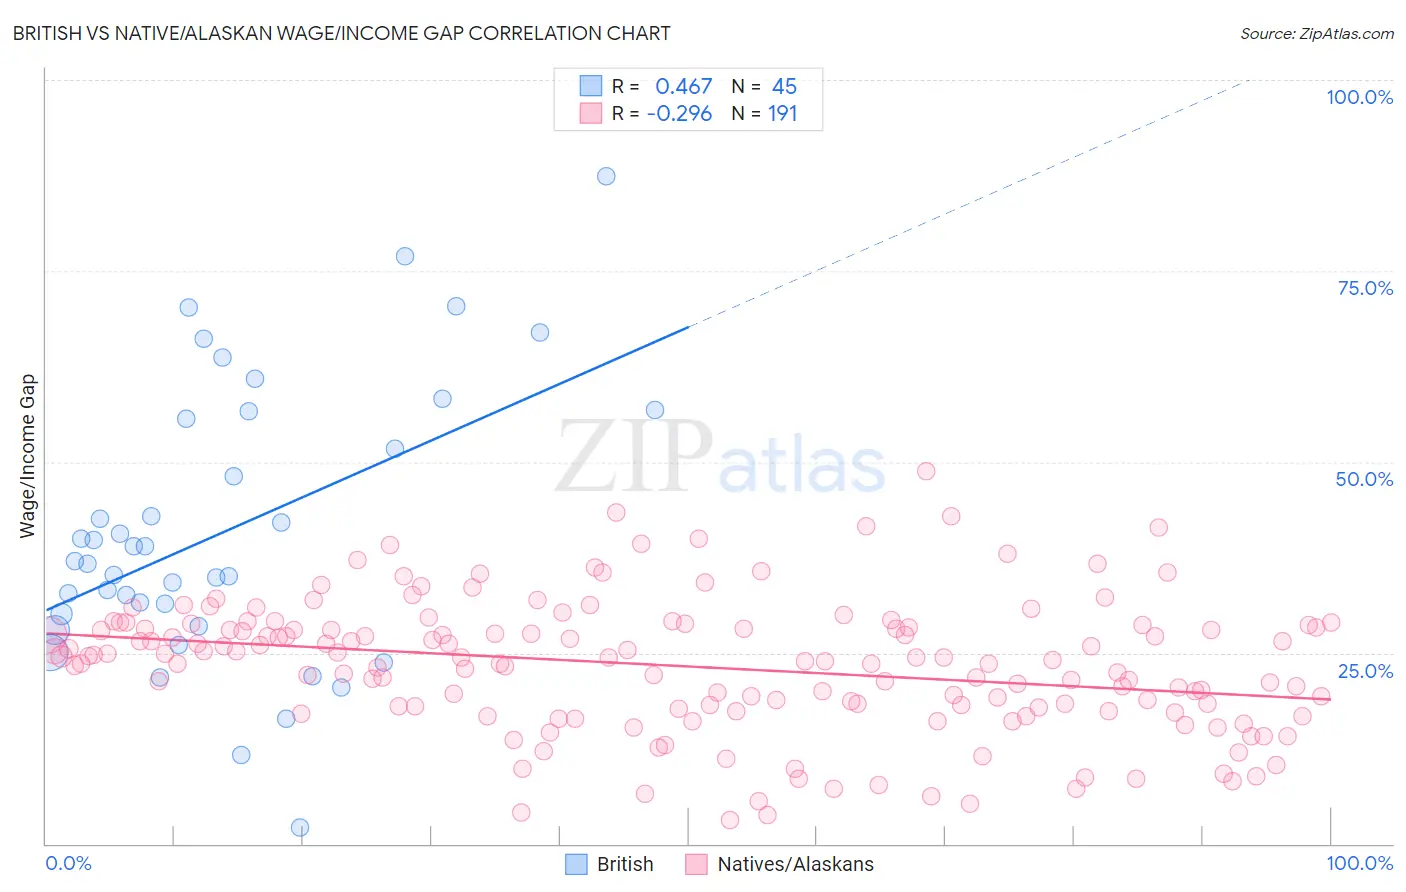
British vs Native/Alaskan Wage/Income Gap Correlation Chart
The statistical analysis conducted on geographies consisting of 530,131,618 people shows a moderate positive correlation between the proportion of British and wage/income gap percentage in the United States with a correlation coefficient (R) of 0.467 and weighted average of 28.9%. Similarly, the statistical analysis conducted on geographies consisting of 511,624,473 people shows a weak negative correlation between the proportion of Natives/Alaskans and wage/income gap percentage in the United States with a correlation coefficient (R) of -0.296 and weighted average of 24.6%, a difference of 17.6%.
Wage/Income Gap Correlation Summary
| Measurement | British | Native/Alaskan |
| Minimum | 2.2% | 3.1% |
| Maximum | 87.4% | 48.8% |
| Range | 85.2% | 45.7% |
| Mean | 41.0% | 23.3% |
| Median | 37.0% | 24.4% |
| Interquartile 25% (IQ1) | 29.3% | 17.8% |
| Interquartile 75% (IQ3) | 56.1% | 28.4% |
| Interquartile Range (IQR) | 26.8% | 10.6% |
| Standard Deviation (Sample) | 18.1% | 8.6% |
| Standard Deviation (Population) | 17.9% | 8.6% |
Similar Demographics by Wage/Income Gap
Demographics Similar to British by Wage/Income Gap
In terms of wage/income gap, the demographic groups most similar to British are Slovak (28.9%, a difference of 0.060%), Welsh (28.9%, a difference of 0.070%), Immigrants from Singapore (28.9%, a difference of 0.080%), Norwegian (29.0%, a difference of 0.19%), and Croatian (29.0%, a difference of 0.31%).
| Demographics | Rating | Rank | Wage/Income Gap |
| French | 0.1 /100 | #313 | Tragic 28.7% |
| Immigrants | Scotland | 0.1 /100 | #314 | Tragic 28.7% |
| Maltese | 0.1 /100 | #315 | Tragic 28.7% |
| Lithuanians | 0.1 /100 | #316 | Tragic 28.7% |
| Belgians | 0.1 /100 | #317 | Tragic 28.8% |
| Basques | 0.1 /100 | #318 | Tragic 28.8% |
| Slovaks | 0.1 /100 | #319 | Tragic 28.9% |
| British | 0.1 /100 | #320 | Tragic 28.9% |
| Welsh | 0.1 /100 | #321 | Tragic 28.9% |
| Immigrants | Singapore | 0.1 /100 | #322 | Tragic 28.9% |
| Norwegians | 0.1 /100 | #323 | Tragic 29.0% |
| Croatians | 0.0 /100 | #324 | Tragic 29.0% |
| Hungarians | 0.0 /100 | #325 | Tragic 29.0% |
| Immigrants | Belgium | 0.0 /100 | #326 | Tragic 29.0% |
| Immigrants | Iran | 0.0 /100 | #327 | Tragic 29.1% |
Demographics Similar to Natives/Alaskans by Wage/Income Gap
In terms of wage/income gap, the demographic groups most similar to Natives/Alaskans are Apache (24.5%, a difference of 0.070%), Immigrants from Thailand (24.5%, a difference of 0.12%), Immigrants from South America (24.6%, a difference of 0.21%), Spanish American (24.6%, a difference of 0.23%), and Immigrants from Uruguay (24.6%, a difference of 0.25%).
| Demographics | Rating | Rank | Wage/Income Gap |
| Alaska Natives | 96.0 /100 | #116 | Exceptional 24.4% |
| Immigrants | Afghanistan | 95.9 /100 | #117 | Exceptional 24.4% |
| Immigrants | Micronesia | 95.8 /100 | #118 | Exceptional 24.4% |
| Kenyans | 95.8 /100 | #119 | Exceptional 24.5% |
| Cree | 95.6 /100 | #120 | Exceptional 24.5% |
| Immigrants | Thailand | 94.9 /100 | #121 | Exceptional 24.5% |
| Apache | 94.8 /100 | #122 | Exceptional 24.5% |
| Natives/Alaskans | 94.6 /100 | #123 | Exceptional 24.6% |
| Immigrants | South America | 93.9 /100 | #124 | Exceptional 24.6% |
| Spanish Americans | 93.8 /100 | #125 | Exceptional 24.6% |
| Immigrants | Uruguay | 93.8 /100 | #126 | Exceptional 24.6% |
| German Russians | 93.7 /100 | #127 | Exceptional 24.6% |
| Immigrants | Central America | 93.5 /100 | #128 | Exceptional 24.6% |
| Yup'ik | 93.3 /100 | #129 | Exceptional 24.7% |
| Alsatians | 93.2 /100 | #130 | Exceptional 24.7% |