Menominee vs Macedonian Median Household Income
COMPARE
Menominee
Macedonian
Median Household Income
Median Household Income Comparison
Menominee
Macedonians
$68,423
MEDIAN HOUSEHOLD INCOME
0.0/ 100
METRIC RATING
328th/ 347
METRIC RANK
$90,761
MEDIAN HOUSEHOLD INCOME
97.4/ 100
METRIC RATING
106th/ 347
METRIC RANK
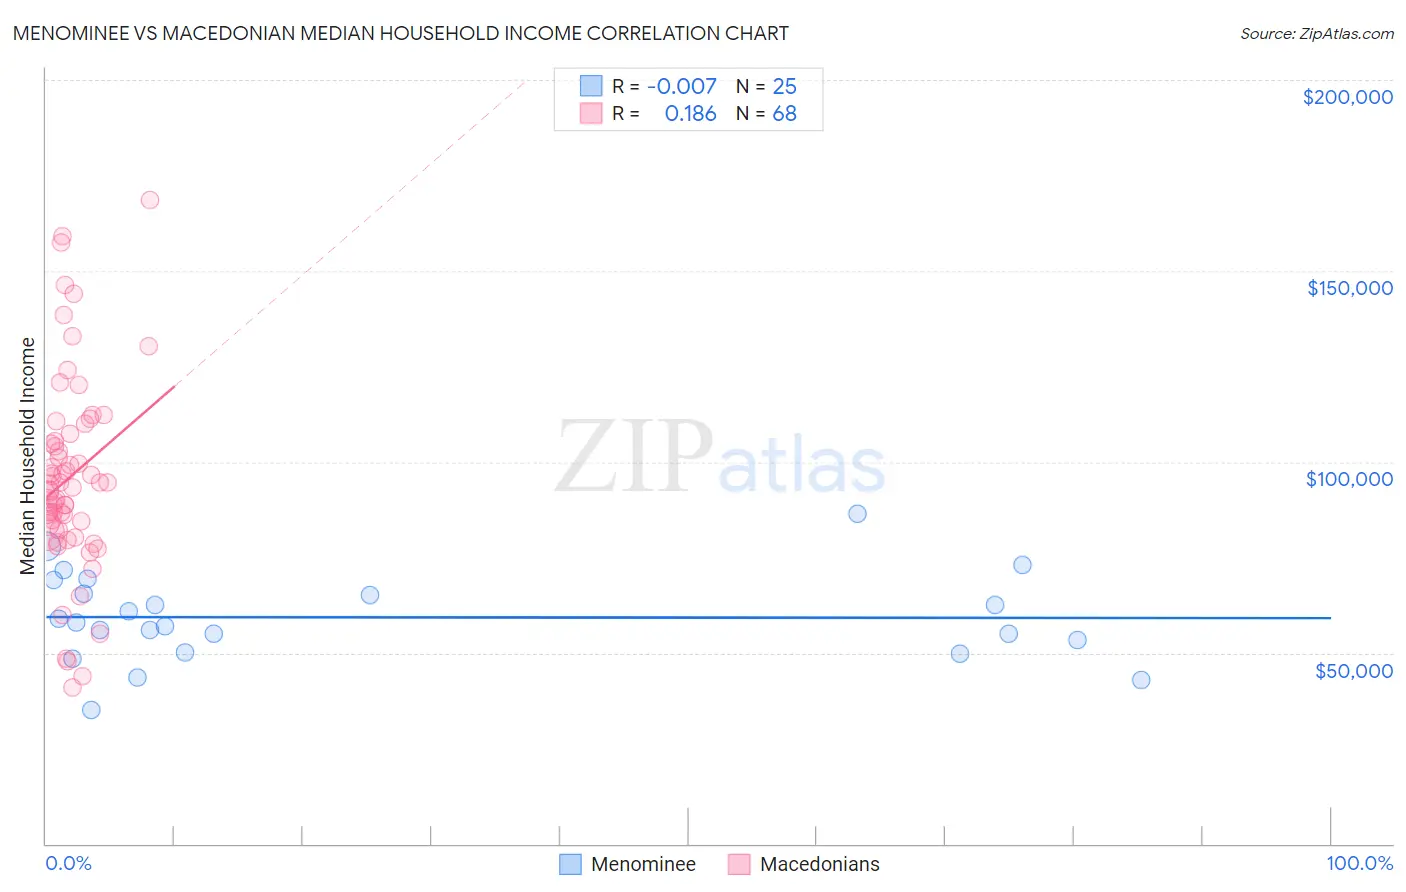
Menominee vs Macedonian Median Household Income Correlation Chart
The statistical analysis conducted on geographies consisting of 45,776,591 people shows no correlation between the proportion of Menominee and median household income in the United States with a correlation coefficient (R) of -0.007 and weighted average of $68,423. Similarly, the statistical analysis conducted on geographies consisting of 132,580,342 people shows a poor positive correlation between the proportion of Macedonians and median household income in the United States with a correlation coefficient (R) of 0.186 and weighted average of $90,761, a difference of 32.7%.
Median Household Income Correlation Summary
| Measurement | Menominee | Macedonian |
| Minimum | $35,112 | $40,833 |
| Maximum | $86,563 | $168,448 |
| Range | $51,451 | $127,615 |
| Mean | $59,292 | $96,021 |
| Median | $57,897 | $93,863 |
| Interquartile 25% (IQ1) | $51,640 | $83,085 |
| Interquartile 75% (IQ3) | $67,237 | $106,377 |
| Interquartile Range (IQR) | $15,596 | $23,292 |
| Standard Deviation (Sample) | $11,591 | $25,740 |
| Standard Deviation (Population) | $11,357 | $25,550 |
Similar Demographics by Median Household Income
Demographics Similar to Menominee by Median Household Income
In terms of median household income, the demographic groups most similar to Menominee are Dutch West Indian ($68,412, a difference of 0.020%), Immigrants from Cuba ($68,461, a difference of 0.060%), Yuman ($68,743, a difference of 0.47%), Arapaho ($67,965, a difference of 0.67%), and Native/Alaskan ($67,879, a difference of 0.80%).
| Demographics | Rating | Rank | Median Household Income |
| Chickasaw | 0.0 /100 | #321 | Tragic $70,005 |
| Choctaw | 0.0 /100 | #322 | Tragic $69,947 |
| Bahamians | 0.0 /100 | #323 | Tragic $69,726 |
| Yup'ik | 0.0 /100 | #324 | Tragic $69,695 |
| Seminole | 0.0 /100 | #325 | Tragic $69,420 |
| Yuman | 0.0 /100 | #326 | Tragic $68,743 |
| Immigrants | Cuba | 0.0 /100 | #327 | Tragic $68,461 |
| Menominee | 0.0 /100 | #328 | Tragic $68,423 |
| Dutch West Indians | 0.0 /100 | #329 | Tragic $68,412 |
| Arapaho | 0.0 /100 | #330 | Tragic $67,965 |
| Natives/Alaskans | 0.0 /100 | #331 | Tragic $67,879 |
| Sioux | 0.0 /100 | #332 | Tragic $67,792 |
| Creek | 0.0 /100 | #333 | Tragic $67,715 |
| Blacks/African Americans | 0.0 /100 | #334 | Tragic $67,573 |
| Cheyenne | 0.0 /100 | #335 | Tragic $66,974 |
Demographics Similar to Macedonians by Median Household Income
In terms of median household income, the demographic groups most similar to Macedonians are Croatian ($90,685, a difference of 0.080%), Immigrants from Brazil ($90,907, a difference of 0.16%), Zimbabwean ($90,618, a difference of 0.16%), Chilean ($90,605, a difference of 0.17%), and Palestinian ($90,574, a difference of 0.21%).
| Demographics | Rating | Rank | Median Household Income |
| Immigrants | South Eastern Asia | 98.4 /100 | #99 | Exceptional $91,541 |
| Ukrainians | 98.3 /100 | #100 | Exceptional $91,456 |
| Immigrants | Moldova | 98.3 /100 | #101 | Exceptional $91,446 |
| Austrians | 98.2 /100 | #102 | Exceptional $91,339 |
| Immigrants | Ukraine | 98.0 /100 | #103 | Exceptional $91,124 |
| Immigrants | Kazakhstan | 97.8 /100 | #104 | Exceptional $91,015 |
| Immigrants | Brazil | 97.7 /100 | #105 | Exceptional $90,907 |
| Macedonians | 97.4 /100 | #106 | Exceptional $90,761 |
| Croatians | 97.3 /100 | #107 | Exceptional $90,685 |
| Zimbabweans | 97.2 /100 | #108 | Exceptional $90,618 |
| Chileans | 97.2 /100 | #109 | Exceptional $90,605 |
| Palestinians | 97.1 /100 | #110 | Exceptional $90,574 |
| Immigrants | Poland | 97.1 /100 | #111 | Exceptional $90,549 |
| Northern Europeans | 96.9 /100 | #112 | Exceptional $90,446 |
| Peruvians | 96.5 /100 | #113 | Exceptional $90,261 |