Immigrants from Jordan vs Macedonian Median Household Income
COMPARE
Immigrants from Jordan
Macedonian
Median Household Income
Median Household Income Comparison
Immigrants from Jordan
Macedonians
$89,412
MEDIAN HOUSEHOLD INCOME
94.1/ 100
METRIC RATING
124th/ 347
METRIC RANK
$90,761
MEDIAN HOUSEHOLD INCOME
97.4/ 100
METRIC RATING
106th/ 347
METRIC RANK
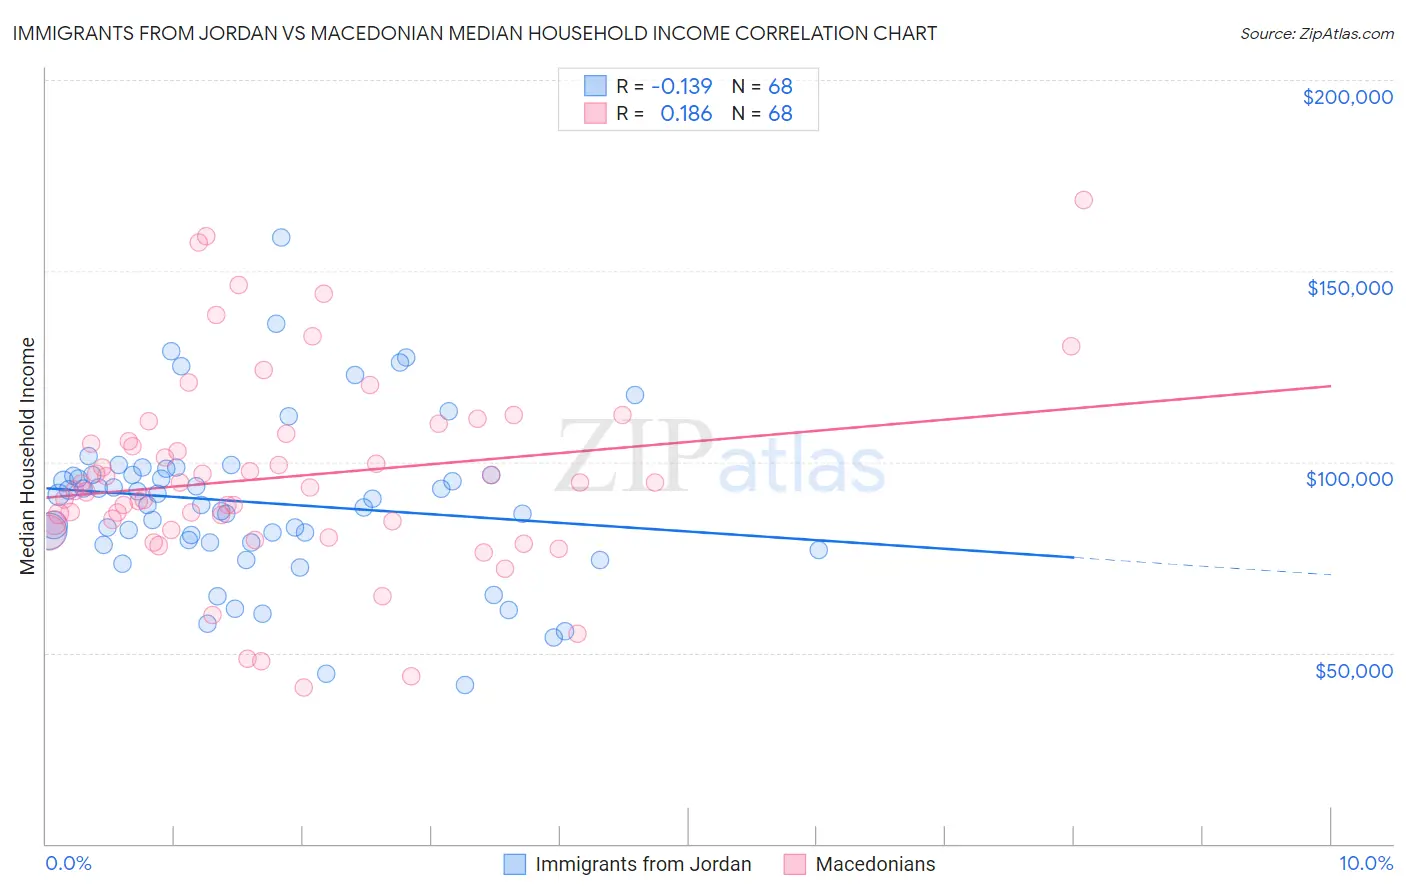
Immigrants from Jordan vs Macedonian Median Household Income Correlation Chart
The statistical analysis conducted on geographies consisting of 181,227,500 people shows a poor negative correlation between the proportion of Immigrants from Jordan and median household income in the United States with a correlation coefficient (R) of -0.139 and weighted average of $89,412. Similarly, the statistical analysis conducted on geographies consisting of 132,580,342 people shows a poor positive correlation between the proportion of Macedonians and median household income in the United States with a correlation coefficient (R) of 0.186 and weighted average of $90,761, a difference of 1.5%.
Median Household Income Correlation Summary
| Measurement | Immigrants from Jordan | Macedonian |
| Minimum | $41,486 | $40,833 |
| Maximum | $158,906 | $168,448 |
| Range | $117,420 | $127,615 |
| Mean | $89,344 | $96,021 |
| Median | $89,581 | $93,863 |
| Interquartile 25% (IQ1) | $78,846 | $83,085 |
| Interquartile 75% (IQ3) | $96,669 | $106,377 |
| Interquartile Range (IQR) | $17,823 | $23,292 |
| Standard Deviation (Sample) | $21,166 | $25,740 |
| Standard Deviation (Population) | $21,010 | $25,550 |
Demographics Similar to Immigrants from Jordan and Macedonians by Median Household Income
In terms of median household income, the demographic groups most similar to Immigrants from Jordan are Immigrants from Zimbabwe ($89,496, a difference of 0.090%), Immigrants from Kuwait ($89,263, a difference of 0.17%), Ethiopian ($89,640, a difference of 0.25%), Pakistani ($89,638, a difference of 0.25%), and Albanian ($89,744, a difference of 0.37%). Similarly, the demographic groups most similar to Macedonians are Croatian ($90,685, a difference of 0.080%), Immigrants from Brazil ($90,907, a difference of 0.16%), Zimbabwean ($90,618, a difference of 0.16%), Chilean ($90,605, a difference of 0.17%), and Palestinian ($90,574, a difference of 0.21%).
| Demographics | Rating | Rank | Median Household Income |
| Immigrants | Brazil | 97.7 /100 | #105 | Exceptional $90,907 |
| Macedonians | 97.4 /100 | #106 | Exceptional $90,761 |
| Croatians | 97.3 /100 | #107 | Exceptional $90,685 |
| Zimbabweans | 97.2 /100 | #108 | Exceptional $90,618 |
| Chileans | 97.2 /100 | #109 | Exceptional $90,605 |
| Palestinians | 97.1 /100 | #110 | Exceptional $90,574 |
| Immigrants | Poland | 97.1 /100 | #111 | Exceptional $90,549 |
| Northern Europeans | 96.9 /100 | #112 | Exceptional $90,446 |
| Peruvians | 96.5 /100 | #113 | Exceptional $90,261 |
| Immigrants | Northern Africa | 95.9 /100 | #114 | Exceptional $90,026 |
| Immigrants | Western Asia | 95.9 /100 | #115 | Exceptional $90,005 |
| Native Hawaiians | 95.7 /100 | #116 | Exceptional $89,919 |
| Taiwanese | 95.6 /100 | #117 | Exceptional $89,900 |
| Syrians | 95.4 /100 | #118 | Exceptional $89,830 |
| Albanians | 95.2 /100 | #119 | Exceptional $89,744 |
| Immigrants | North Macedonia | 95.2 /100 | #120 | Exceptional $89,741 |
| Ethiopians | 94.9 /100 | #121 | Exceptional $89,640 |
| Pakistanis | 94.8 /100 | #122 | Exceptional $89,638 |
| Immigrants | Zimbabwe | 94.4 /100 | #123 | Exceptional $89,496 |
| Immigrants | Jordan | 94.1 /100 | #124 | Exceptional $89,412 |
| Immigrants | Kuwait | 93.5 /100 | #125 | Exceptional $89,263 |