Bhutanese vs Soviet Union Householder Income Over 65 years
COMPARE
Bhutanese
Soviet Union
Householder Income Over 65 years
Householder Income Over 65 years Comparison
Bhutanese
Soviet Union
$72,288
HOUSEHOLDER INCOME OVER 65 YEARS
100.0/ 100
METRIC RATING
10th/ 347
METRIC RANK
$62,848
HOUSEHOLDER INCOME OVER 65 YEARS
87.8/ 100
METRIC RATING
125th/ 347
METRIC RANK
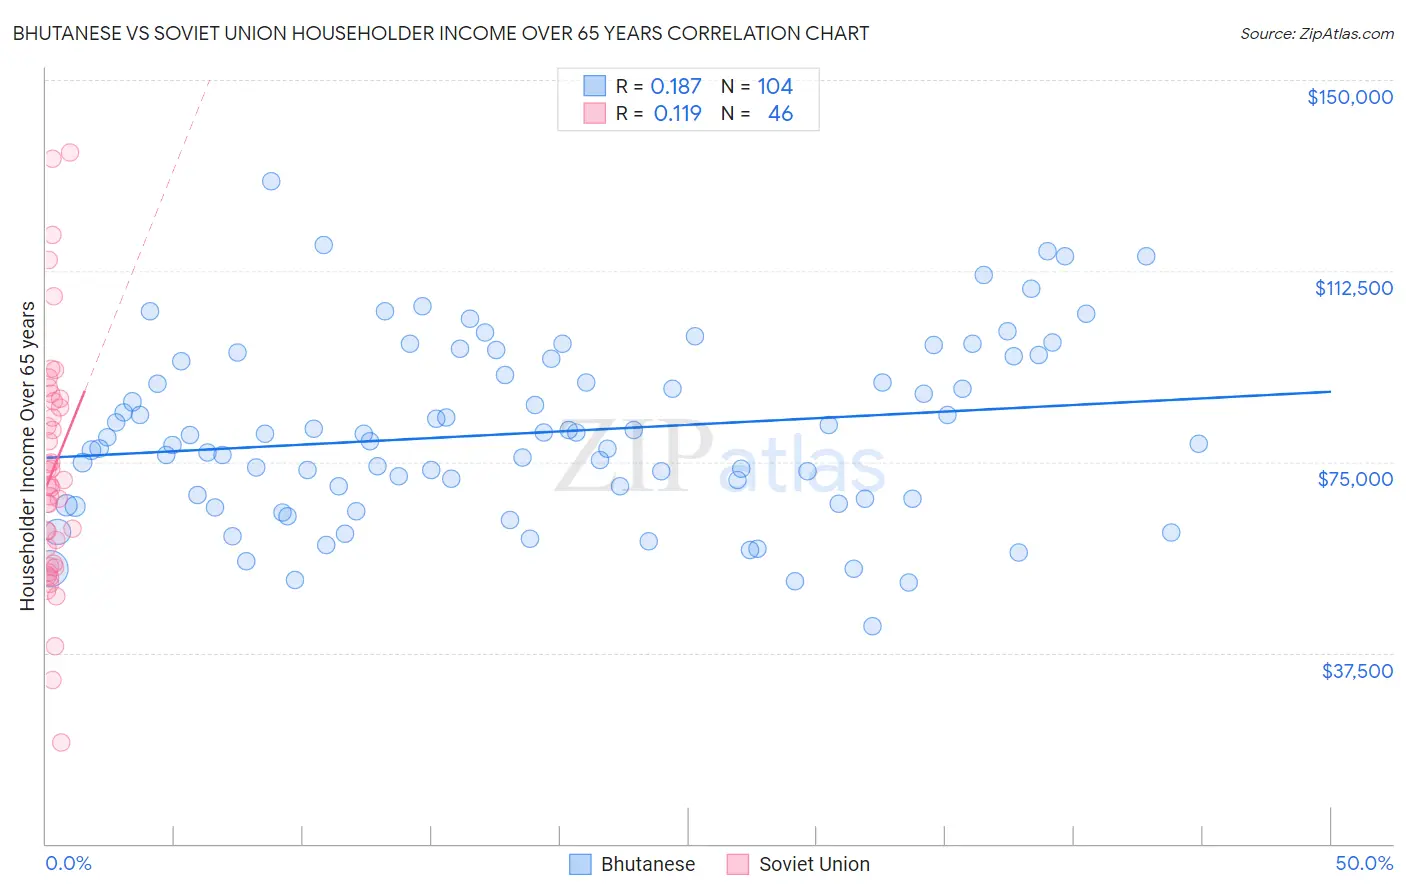
Bhutanese vs Soviet Union Householder Income Over 65 years Correlation Chart
The statistical analysis conducted on geographies consisting of 453,217,193 people shows a poor positive correlation between the proportion of Bhutanese and household income with householder over the age of 65 in the United States with a correlation coefficient (R) of 0.187 and weighted average of $72,288. Similarly, the statistical analysis conducted on geographies consisting of 43,499,158 people shows a poor positive correlation between the proportion of Soviet Union and household income with householder over the age of 65 in the United States with a correlation coefficient (R) of 0.119 and weighted average of $62,848, a difference of 15.0%.
Householder Income Over 65 years Correlation Summary
| Measurement | Bhutanese | Soviet Union |
| Minimum | $42,695 | $19,854 |
| Maximum | $130,207 | $135,833 |
| Range | $87,512 | $115,979 |
| Mean | $80,718 | $73,206 |
| Median | $79,378 | $70,343 |
| Interquartile 25% (IQ1) | $67,810 | $54,958 |
| Interquartile 75% (IQ3) | $95,004 | $87,025 |
| Interquartile Range (IQR) | $27,195 | $32,067 |
| Standard Deviation (Sample) | $17,380 | $23,972 |
| Standard Deviation (Population) | $17,296 | $23,710 |
Similar Demographics by Householder Income Over 65 years
Demographics Similar to Bhutanese by Householder Income Over 65 years
In terms of householder income over 65 years, the demographic groups most similar to Bhutanese are Thai ($72,099, a difference of 0.26%), Immigrants from India ($72,804, a difference of 0.71%), Cypriot ($71,714, a difference of 0.80%), Immigrants from Singapore ($72,963, a difference of 0.93%), and Immigrants from Hong Kong ($71,567, a difference of 1.0%).
| Demographics | Rating | Rank | Householder Income Over 65 years |
| Immigrants | Taiwan | 100.0 /100 | #3 | Exceptional $77,051 |
| Filipinos | 100.0 /100 | #4 | Exceptional $76,686 |
| Immigrants | Iran | 100.0 /100 | #5 | Exceptional $75,081 |
| Bolivians | 100.0 /100 | #6 | Exceptional $74,245 |
| Immigrants | Bolivia | 100.0 /100 | #7 | Exceptional $73,434 |
| Immigrants | Singapore | 100.0 /100 | #8 | Exceptional $72,963 |
| Immigrants | India | 100.0 /100 | #9 | Exceptional $72,804 |
| Bhutanese | 100.0 /100 | #10 | Exceptional $72,288 |
| Thais | 100.0 /100 | #11 | Exceptional $72,099 |
| Cypriots | 100.0 /100 | #12 | Exceptional $71,714 |
| Immigrants | Hong Kong | 100.0 /100 | #13 | Exceptional $71,567 |
| Burmese | 100.0 /100 | #14 | Exceptional $71,139 |
| Native Hawaiians | 100.0 /100 | #15 | Exceptional $71,021 |
| Okinawans | 100.0 /100 | #16 | Exceptional $70,846 |
| Immigrants | Korea | 100.0 /100 | #17 | Exceptional $70,696 |
Demographics Similar to Soviet Union by Householder Income Over 65 years
In terms of householder income over 65 years, the demographic groups most similar to Soviet Union are Taiwanese ($62,894, a difference of 0.070%), Tlingit-Haida ($62,922, a difference of 0.12%), Peruvian ($62,766, a difference of 0.13%), Immigrants from Moldova ($62,939, a difference of 0.14%), and Swedish ($62,736, a difference of 0.18%).
| Demographics | Rating | Rank | Householder Income Over 65 years |
| Danes | 90.5 /100 | #118 | Exceptional $63,117 |
| Immigrants | Jordan | 89.8 /100 | #119 | Excellent $63,041 |
| Ukrainians | 89.7 /100 | #120 | Excellent $63,032 |
| Immigrants | Vietnam | 89.5 /100 | #121 | Excellent $63,014 |
| Immigrants | Moldova | 88.7 /100 | #122 | Excellent $62,939 |
| Tlingit-Haida | 88.6 /100 | #123 | Excellent $62,922 |
| Taiwanese | 88.3 /100 | #124 | Excellent $62,894 |
| Soviet Union | 87.8 /100 | #125 | Excellent $62,848 |
| Peruvians | 86.8 /100 | #126 | Excellent $62,766 |
| Swedes | 86.4 /100 | #127 | Excellent $62,736 |
| Aleuts | 86.1 /100 | #128 | Excellent $62,708 |
| Immigrants | Eastern Europe | 85.9 /100 | #129 | Excellent $62,693 |
| Basques | 85.4 /100 | #130 | Excellent $62,653 |
| Immigrants | Western Asia | 85.3 /100 | #131 | Excellent $62,645 |
| Immigrants | Germany | 83.9 /100 | #132 | Excellent $62,544 |