Alaska Native vs Burmese Householder Income Ages 45 - 64 years
COMPARE
Alaska Native
Burmese
Householder Income Ages 45 - 64 years
Householder Income Ages 45 - 64 years Comparison
Alaska Natives
Burmese
$93,991
HOUSEHOLDER INCOME AGES 45 - 64 YEARS
4.0/ 100
METRIC RATING
227th/ 347
METRIC RANK
$121,444
HOUSEHOLDER INCOME AGES 45 - 64 YEARS
100.0/ 100
METRIC RATING
17th/ 347
METRIC RANK
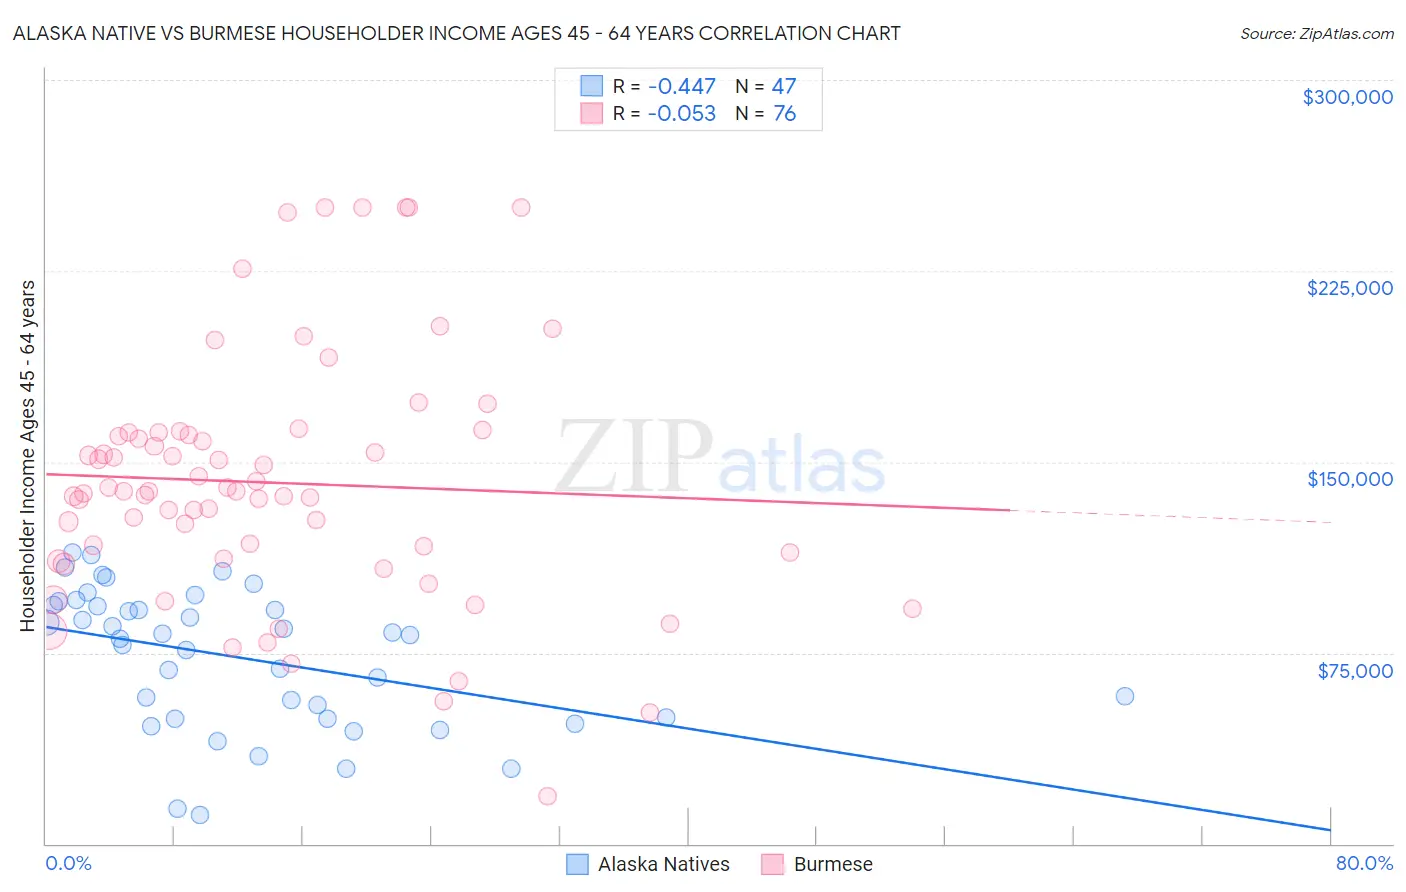
Alaska Native vs Burmese Householder Income Ages 45 - 64 years Correlation Chart
The statistical analysis conducted on geographies consisting of 76,694,655 people shows a moderate negative correlation between the proportion of Alaska Natives and household income with householder between the ages 45 and 64 in the United States with a correlation coefficient (R) of -0.447 and weighted average of $93,991. Similarly, the statistical analysis conducted on geographies consisting of 464,084,220 people shows a slight negative correlation between the proportion of Burmese and household income with householder between the ages 45 and 64 in the United States with a correlation coefficient (R) of -0.053 and weighted average of $121,444, a difference of 29.2%.
Householder Income Ages 45 - 64 years Correlation Summary
| Measurement | Alaska Native | Burmese |
| Minimum | $11,250 | $18,640 |
| Maximum | $114,284 | $250,001 |
| Range | $103,034 | $231,361 |
| Mean | $73,165 | $141,791 |
| Median | $81,875 | $138,461 |
| Interquartile 25% (IQ1) | $49,167 | $113,099 |
| Interquartile 75% (IQ3) | $93,652 | $160,979 |
| Interquartile Range (IQR) | $44,485 | $47,880 |
| Standard Deviation (Sample) | $27,050 | $48,701 |
| Standard Deviation (Population) | $26,761 | $48,379 |
Similar Demographics by Householder Income Ages 45 - 64 years
Demographics Similar to Alaska Natives by Householder Income Ages 45 - 64 years
In terms of householder income ages 45 - 64 years, the demographic groups most similar to Alaska Natives are Immigrants from the Azores ($94,138, a difference of 0.16%), Immigrants from Panama ($93,815, a difference of 0.19%), Bermudan ($94,197, a difference of 0.22%), Vietnamese ($93,788, a difference of 0.22%), and Immigrants from Sudan ($93,781, a difference of 0.22%).
| Demographics | Rating | Rank | Householder Income Ages 45 - 64 years |
| Salvadorans | 6.0 /100 | #220 | Tragic $94,842 |
| Immigrants | Nigeria | 5.9 /100 | #221 | Tragic $94,804 |
| Malaysians | 5.2 /100 | #222 | Tragic $94,517 |
| Immigrants | Nonimmigrants | 5.0 /100 | #223 | Tragic $94,448 |
| Immigrants | Bosnia and Herzegovina | 4.6 /100 | #224 | Tragic $94,288 |
| Bermudans | 4.4 /100 | #225 | Tragic $94,197 |
| Immigrants | Azores | 4.3 /100 | #226 | Tragic $94,138 |
| Alaska Natives | 4.0 /100 | #227 | Tragic $93,991 |
| Immigrants | Panama | 3.7 /100 | #228 | Tragic $93,815 |
| Vietnamese | 3.6 /100 | #229 | Tragic $93,788 |
| Immigrants | Sudan | 3.6 /100 | #230 | Tragic $93,781 |
| Ecuadorians | 3.6 /100 | #231 | Tragic $93,739 |
| Sudanese | 3.5 /100 | #232 | Tragic $93,718 |
| Nepalese | 3.0 /100 | #233 | Tragic $93,355 |
| Immigrants | El Salvador | 2.7 /100 | #234 | Tragic $93,176 |
Demographics Similar to Burmese by Householder Income Ages 45 - 64 years
In terms of householder income ages 45 - 64 years, the demographic groups most similar to Burmese are Immigrants from Korea ($121,243, a difference of 0.17%), Immigrants from China ($122,178, a difference of 0.60%), Eastern European ($120,684, a difference of 0.63%), Immigrants from Eastern Asia ($122,222, a difference of 0.64%), and Indian (Asian) ($122,343, a difference of 0.74%).
| Demographics | Rating | Rank | Householder Income Ages 45 - 64 years |
| Immigrants | South Central Asia | 100.0 /100 | #10 | Exceptional $124,188 |
| Cypriots | 100.0 /100 | #11 | Exceptional $123,396 |
| Immigrants | Israel | 100.0 /100 | #12 | Exceptional $122,893 |
| Immigrants | Ireland | 100.0 /100 | #13 | Exceptional $122,757 |
| Indians (Asian) | 100.0 /100 | #14 | Exceptional $122,343 |
| Immigrants | Eastern Asia | 100.0 /100 | #15 | Exceptional $122,222 |
| Immigrants | China | 100.0 /100 | #16 | Exceptional $122,178 |
| Burmese | 100.0 /100 | #17 | Exceptional $121,444 |
| Immigrants | Korea | 100.0 /100 | #18 | Exceptional $121,243 |
| Eastern Europeans | 100.0 /100 | #19 | Exceptional $120,684 |
| Immigrants | Australia | 100.0 /100 | #20 | Exceptional $119,308 |
| Immigrants | Sri Lanka | 100.0 /100 | #21 | Exceptional $119,094 |
| Immigrants | Belgium | 100.0 /100 | #22 | Exceptional $118,932 |
| Bolivians | 100.0 /100 | #23 | Exceptional $118,871 |
| Immigrants | Japan | 100.0 /100 | #24 | Exceptional $118,498 |