Bermudan vs Immigrants from Moldova Householder Income Over 65 years
COMPARE
Bermudan
Immigrants from Moldova
Householder Income Over 65 years
Householder Income Over 65 years Comparison
Bermudans
Immigrants from Moldova
$58,171
HOUSEHOLDER INCOME OVER 65 YEARS
5.1/ 100
METRIC RATING
224th/ 347
METRIC RANK
$62,939
HOUSEHOLDER INCOME OVER 65 YEARS
88.7/ 100
METRIC RATING
122nd/ 347
METRIC RANK
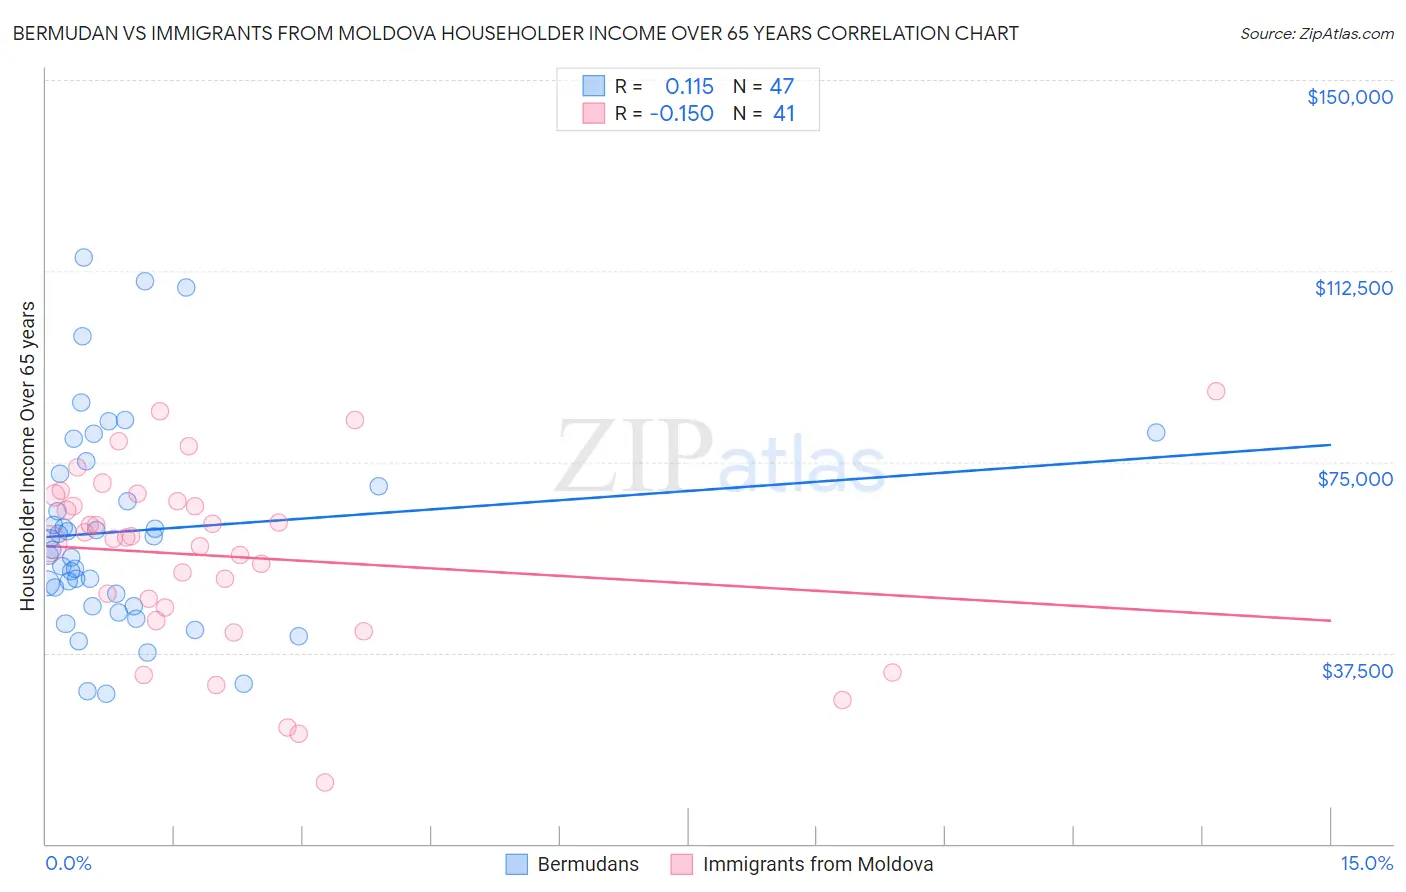
Bermudan vs Immigrants from Moldova Householder Income Over 65 years Correlation Chart
The statistical analysis conducted on geographies consisting of 55,673,391 people shows a poor positive correlation between the proportion of Bermudans and household income with householder over the age of 65 in the United States with a correlation coefficient (R) of 0.115 and weighted average of $58,171. Similarly, the statistical analysis conducted on geographies consisting of 124,248,392 people shows a poor negative correlation between the proportion of Immigrants from Moldova and household income with householder over the age of 65 in the United States with a correlation coefficient (R) of -0.150 and weighted average of $62,939, a difference of 8.2%.
Householder Income Over 65 years Correlation Summary
| Measurement | Bermudan | Immigrants from Moldova |
| Minimum | $29,369 | $12,021 |
| Maximum | $115,179 | $88,833 |
| Range | $85,810 | $76,812 |
| Mean | $61,411 | $56,381 |
| Median | $57,809 | $60,083 |
| Interquartile 25% (IQ1) | $46,689 | $45,078 |
| Interquartile 75% (IQ3) | $72,720 | $67,835 |
| Interquartile Range (IQR) | $26,031 | $22,757 |
| Standard Deviation (Sample) | $20,368 | $17,894 |
| Standard Deviation (Population) | $20,150 | $17,674 |
Similar Demographics by Householder Income Over 65 years
Demographics Similar to Bermudans by Householder Income Over 65 years
In terms of householder income over 65 years, the demographic groups most similar to Bermudans are Tsimshian ($58,202, a difference of 0.050%), Delaware ($58,214, a difference of 0.080%), Immigrants from El Salvador ($58,226, a difference of 0.10%), Yugoslavian ($58,243, a difference of 0.12%), and Malaysian ($58,244, a difference of 0.13%).
| Demographics | Rating | Rank | Householder Income Over 65 years |
| Sudanese | 5.7 /100 | #217 | Tragic $58,281 |
| Panamanians | 5.6 /100 | #218 | Tragic $58,266 |
| Malaysians | 5.5 /100 | #219 | Tragic $58,244 |
| Yugoslavians | 5.5 /100 | #220 | Tragic $58,243 |
| Immigrants | El Salvador | 5.4 /100 | #221 | Tragic $58,226 |
| Delaware | 5.3 /100 | #222 | Tragic $58,214 |
| Tsimshian | 5.2 /100 | #223 | Tragic $58,202 |
| Bermudans | 5.1 /100 | #224 | Tragic $58,171 |
| Venezuelans | 4.4 /100 | #225 | Tragic $58,026 |
| French Canadians | 4.2 /100 | #226 | Tragic $57,975 |
| Japanese | 3.9 /100 | #227 | Tragic $57,919 |
| Immigrants | Albania | 3.6 /100 | #228 | Tragic $57,828 |
| Immigrants | Colombia | 3.0 /100 | #229 | Tragic $57,658 |
| Immigrants | Cambodia | 2.8 /100 | #230 | Tragic $57,580 |
| Immigrants | Nonimmigrants | 2.4 /100 | #231 | Tragic $57,426 |
Demographics Similar to Immigrants from Moldova by Householder Income Over 65 years
In terms of householder income over 65 years, the demographic groups most similar to Immigrants from Moldova are Tlingit-Haida ($62,922, a difference of 0.030%), Taiwanese ($62,894, a difference of 0.070%), Immigrants from Vietnam ($63,014, a difference of 0.12%), Soviet Union ($62,848, a difference of 0.14%), and Ukrainian ($63,032, a difference of 0.15%).
| Demographics | Rating | Rank | Householder Income Over 65 years |
| Croatians | 91.4 /100 | #115 | Exceptional $63,225 |
| Guamanians/Chamorros | 91.1 /100 | #116 | Exceptional $63,187 |
| Immigrants | Croatia | 90.9 /100 | #117 | Exceptional $63,168 |
| Danes | 90.5 /100 | #118 | Exceptional $63,117 |
| Immigrants | Jordan | 89.8 /100 | #119 | Excellent $63,041 |
| Ukrainians | 89.7 /100 | #120 | Excellent $63,032 |
| Immigrants | Vietnam | 89.5 /100 | #121 | Excellent $63,014 |
| Immigrants | Moldova | 88.7 /100 | #122 | Excellent $62,939 |
| Tlingit-Haida | 88.6 /100 | #123 | Excellent $62,922 |
| Taiwanese | 88.3 /100 | #124 | Excellent $62,894 |
| Soviet Union | 87.8 /100 | #125 | Excellent $62,848 |
| Peruvians | 86.8 /100 | #126 | Excellent $62,766 |
| Swedes | 86.4 /100 | #127 | Excellent $62,736 |
| Aleuts | 86.1 /100 | #128 | Excellent $62,708 |
| Immigrants | Eastern Europe | 85.9 /100 | #129 | Excellent $62,693 |