Bermudan vs Spanish Median Family Income
COMPARE
Bermudan
Spanish
Median Family Income
Median Family Income Comparison
Bermudans
Spanish
$97,577
MEDIAN FAMILY INCOME
6.9/ 100
METRIC RATING
214th/ 347
METRIC RANK
$99,977
MEDIAN FAMILY INCOME
20.1/ 100
METRIC RATING
200th/ 347
METRIC RANK
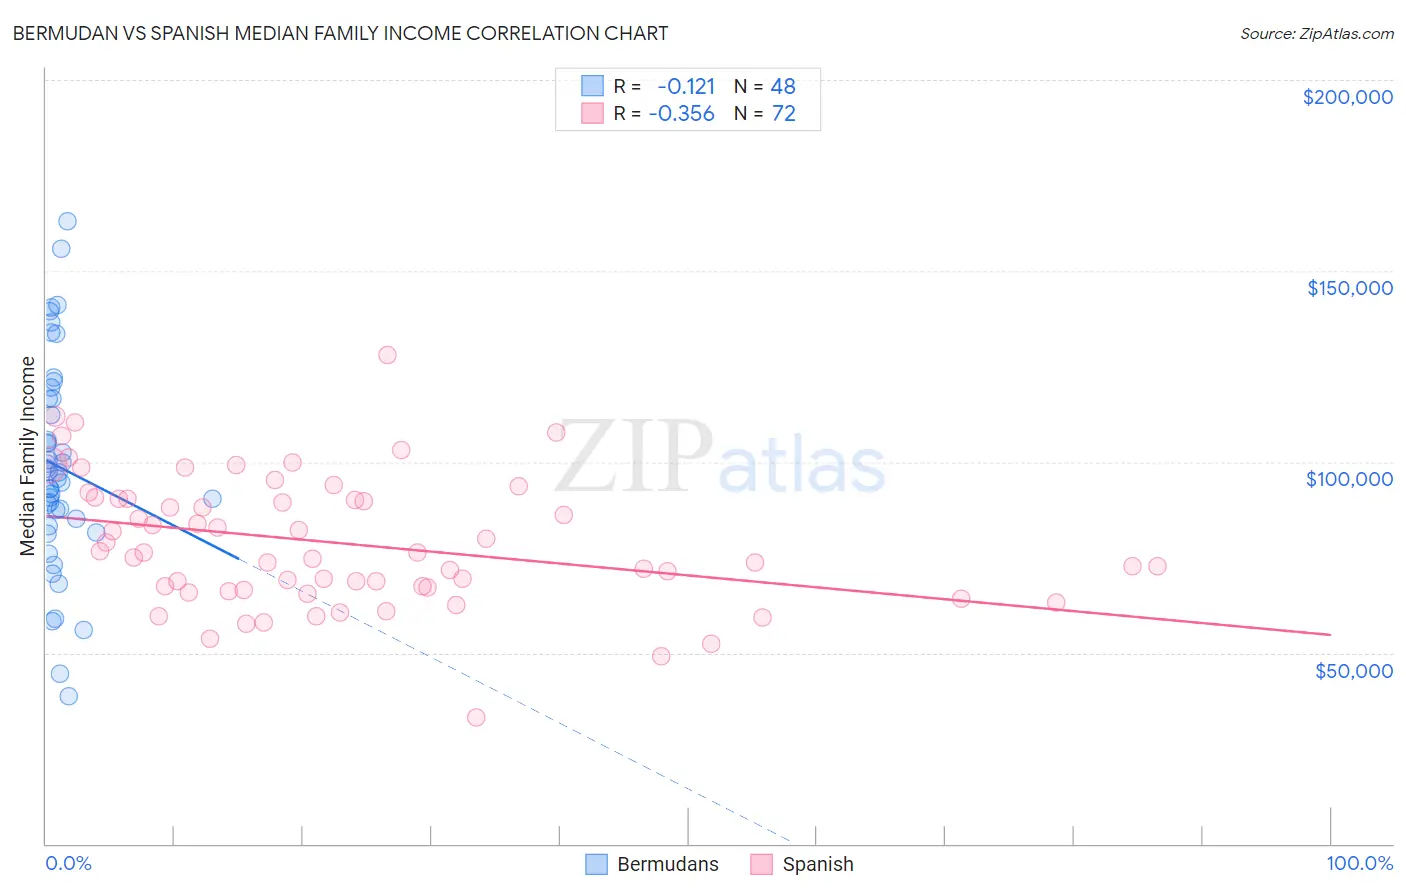
Bermudan vs Spanish Median Family Income Correlation Chart
The statistical analysis conducted on geographies consisting of 55,709,060 people shows a poor negative correlation between the proportion of Bermudans and median family income in the United States with a correlation coefficient (R) of -0.121 and weighted average of $97,577. Similarly, the statistical analysis conducted on geographies consisting of 421,758,667 people shows a mild negative correlation between the proportion of Spanish and median family income in the United States with a correlation coefficient (R) of -0.356 and weighted average of $99,977, a difference of 2.5%.
Median Family Income Correlation Summary
| Measurement | Bermudan | Spanish |
| Minimum | $38,750 | $32,992 |
| Maximum | $163,000 | $127,945 |
| Range | $124,250 | $94,953 |
| Mean | $98,727 | $78,597 |
| Median | $96,344 | $75,704 |
| Interquartile 25% (IQ1) | $84,141 | $66,829 |
| Interquartile 75% (IQ3) | $116,507 | $90,296 |
| Interquartile Range (IQR) | $32,365 | $23,466 |
| Standard Deviation (Sample) | $27,353 | $17,174 |
| Standard Deviation (Population) | $27,067 | $17,054 |
Demographics Similar to Bermudans and Spanish by Median Family Income
In terms of median family income, the demographic groups most similar to Bermudans are Immigrants from Armenia ($97,605, a difference of 0.030%), Nigerian ($97,522, a difference of 0.060%), Panamanian ($97,683, a difference of 0.11%), Immigrants from Bosnia and Herzegovina ($97,432, a difference of 0.15%), and Immigrants from Sudan ($97,737, a difference of 0.16%). Similarly, the demographic groups most similar to Spanish are Yugoslavian ($100,119, a difference of 0.14%), Immigrants from Thailand ($99,840, a difference of 0.14%), White/Caucasian ($99,800, a difference of 0.18%), Immigrants from Africa ($100,256, a difference of 0.28%), and Immigrants from Cameroon ($100,289, a difference of 0.31%).
| Demographics | Rating | Rank | Median Family Income |
| Immigrants | Cameroon | 22.8 /100 | #197 | Fair $100,289 |
| Immigrants | Africa | 22.5 /100 | #198 | Fair $100,256 |
| Yugoslavians | 21.3 /100 | #199 | Fair $100,119 |
| Spanish | 20.1 /100 | #200 | Fair $99,977 |
| Immigrants | Thailand | 19.0 /100 | #201 | Poor $99,840 |
| Whites/Caucasians | 18.7 /100 | #202 | Poor $99,800 |
| Scotch-Irish | 17.1 /100 | #203 | Poor $99,591 |
| Ghanaians | 12.6 /100 | #204 | Poor $98,877 |
| Hawaiians | 12.5 /100 | #205 | Poor $98,869 |
| Immigrants | Iraq | 12.1 /100 | #206 | Poor $98,786 |
| Aleuts | 11.6 /100 | #207 | Poor $98,702 |
| Immigrants | Uruguay | 9.2 /100 | #208 | Tragic $98,205 |
| Immigrants | Colombia | 8.7 /100 | #209 | Tragic $98,067 |
| Puget Sound Salish | 8.2 /100 | #210 | Tragic $97,958 |
| Immigrants | Sudan | 7.4 /100 | #211 | Tragic $97,737 |
| Panamanians | 7.2 /100 | #212 | Tragic $97,683 |
| Immigrants | Armenia | 7.0 /100 | #213 | Tragic $97,605 |
| Bermudans | 6.9 /100 | #214 | Tragic $97,577 |
| Nigerians | 6.7 /100 | #215 | Tragic $97,522 |
| Immigrants | Bosnia and Herzegovina | 6.4 /100 | #216 | Tragic $97,432 |
| Japanese | 6.0 /100 | #217 | Tragic $97,288 |