Bermudan vs Immigrants from Hungary Median Family Income
COMPARE
Bermudan
Immigrants from Hungary
Median Family Income
Median Family Income Comparison
Bermudans
Immigrants from Hungary
$97,577
MEDIAN FAMILY INCOME
6.9/ 100
METRIC RATING
214th/ 347
METRIC RANK
$111,378
MEDIAN FAMILY INCOME
98.8/ 100
METRIC RATING
84th/ 347
METRIC RANK
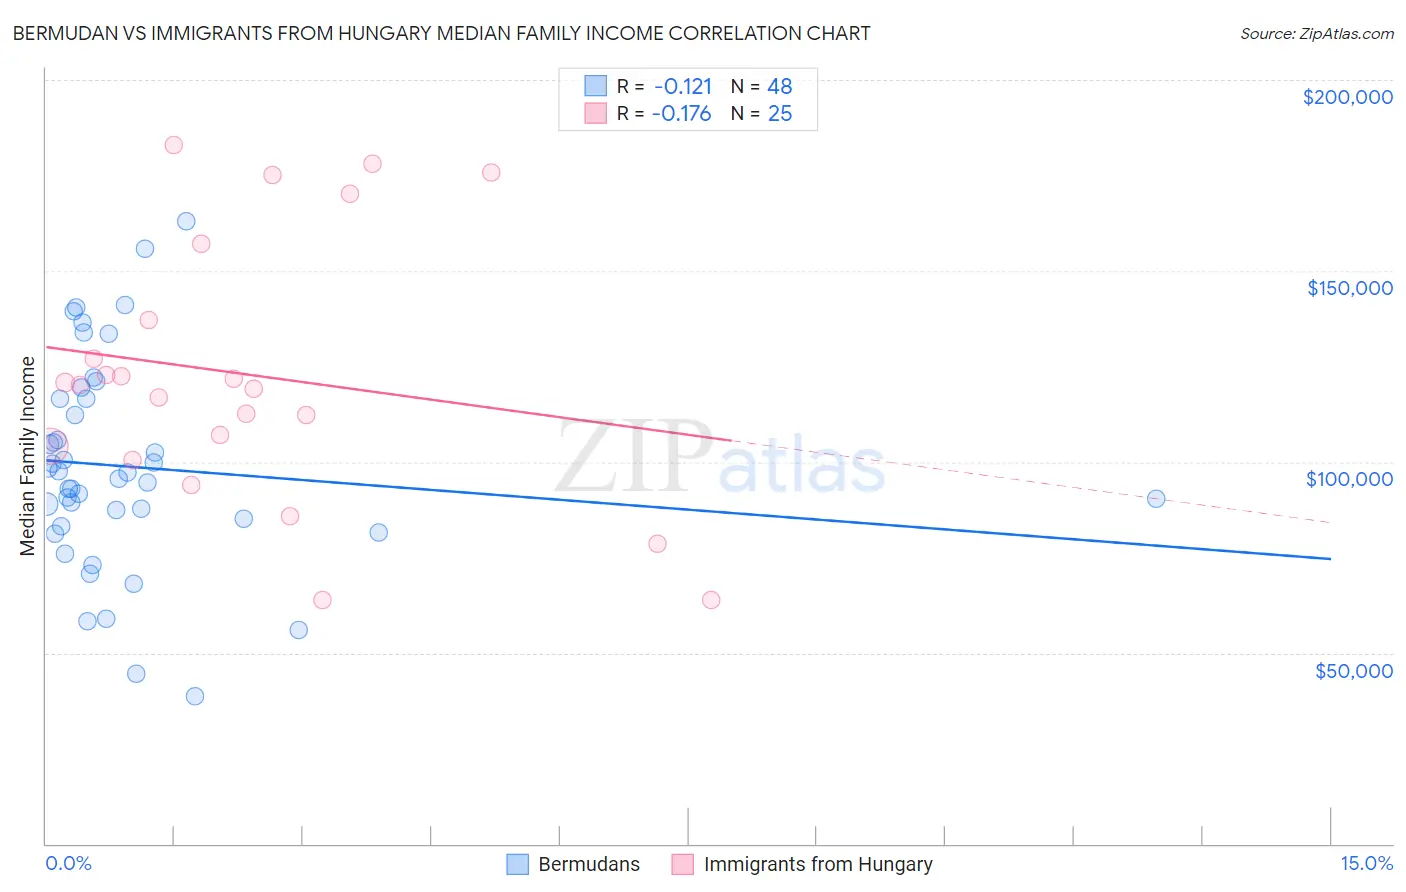
Bermudan vs Immigrants from Hungary Median Family Income Correlation Chart
The statistical analysis conducted on geographies consisting of 55,709,060 people shows a poor negative correlation between the proportion of Bermudans and median family income in the United States with a correlation coefficient (R) of -0.121 and weighted average of $97,577. Similarly, the statistical analysis conducted on geographies consisting of 195,642,900 people shows a poor negative correlation between the proportion of Immigrants from Hungary and median family income in the United States with a correlation coefficient (R) of -0.176 and weighted average of $111,378, a difference of 14.1%.
Median Family Income Correlation Summary
| Measurement | Bermudan | Immigrants from Hungary |
| Minimum | $38,750 | $63,750 |
| Maximum | $163,000 | $183,055 |
| Range | $124,250 | $119,305 |
| Mean | $98,727 | $122,792 |
| Median | $96,344 | $120,051 |
| Interquartile 25% (IQ1) | $84,141 | $102,275 |
| Interquartile 75% (IQ3) | $116,507 | $147,198 |
| Interquartile Range (IQR) | $32,365 | $44,923 |
| Standard Deviation (Sample) | $27,353 | $34,384 |
| Standard Deviation (Population) | $27,067 | $33,690 |
Similar Demographics by Median Family Income
Demographics Similar to Bermudans by Median Family Income
In terms of median family income, the demographic groups most similar to Bermudans are Immigrants from Armenia ($97,605, a difference of 0.030%), Nigerian ($97,522, a difference of 0.060%), Panamanian ($97,683, a difference of 0.11%), Immigrants from Bosnia and Herzegovina ($97,432, a difference of 0.15%), and Immigrants from Sudan ($97,737, a difference of 0.16%).
| Demographics | Rating | Rank | Median Family Income |
| Aleuts | 11.6 /100 | #207 | Poor $98,702 |
| Immigrants | Uruguay | 9.2 /100 | #208 | Tragic $98,205 |
| Immigrants | Colombia | 8.7 /100 | #209 | Tragic $98,067 |
| Puget Sound Salish | 8.2 /100 | #210 | Tragic $97,958 |
| Immigrants | Sudan | 7.4 /100 | #211 | Tragic $97,737 |
| Panamanians | 7.2 /100 | #212 | Tragic $97,683 |
| Immigrants | Armenia | 7.0 /100 | #213 | Tragic $97,605 |
| Bermudans | 6.9 /100 | #214 | Tragic $97,577 |
| Nigerians | 6.7 /100 | #215 | Tragic $97,522 |
| Immigrants | Bosnia and Herzegovina | 6.4 /100 | #216 | Tragic $97,432 |
| Japanese | 6.0 /100 | #217 | Tragic $97,288 |
| Immigrants | Cambodia | 5.8 /100 | #218 | Tragic $97,222 |
| Delaware | 5.1 /100 | #219 | Tragic $96,958 |
| Sudanese | 4.7 /100 | #220 | Tragic $96,783 |
| Immigrants | Ghana | 4.2 /100 | #221 | Tragic $96,544 |
Demographics Similar to Immigrants from Hungary by Median Family Income
In terms of median family income, the demographic groups most similar to Immigrants from Hungary are Croatian ($111,370, a difference of 0.010%), Ukrainian ($111,368, a difference of 0.010%), Austrian ($111,306, a difference of 0.060%), Romanian ($111,243, a difference of 0.12%), and Immigrants from Egypt ($111,689, a difference of 0.28%).
| Demographics | Rating | Rank | Median Family Income |
| Immigrants | Eastern Europe | 99.4 /100 | #77 | Exceptional $112,527 |
| Immigrants | Canada | 99.3 /100 | #78 | Exceptional $112,374 |
| Italians | 99.3 /100 | #79 | Exceptional $112,372 |
| Immigrants | Croatia | 99.3 /100 | #80 | Exceptional $112,323 |
| Immigrants | North America | 99.2 /100 | #81 | Exceptional $112,151 |
| Immigrants | England | 99.2 /100 | #82 | Exceptional $112,038 |
| Immigrants | Egypt | 99.0 /100 | #83 | Exceptional $111,689 |
| Immigrants | Hungary | 98.8 /100 | #84 | Exceptional $111,378 |
| Croatians | 98.8 /100 | #85 | Exceptional $111,370 |
| Ukrainians | 98.8 /100 | #86 | Exceptional $111,368 |
| Austrians | 98.8 /100 | #87 | Exceptional $111,306 |
| Romanians | 98.8 /100 | #88 | Exceptional $111,243 |
| Immigrants | Argentina | 98.5 /100 | #89 | Exceptional $110,873 |
| Northern Europeans | 98.3 /100 | #90 | Exceptional $110,635 |
| Immigrants | Southern Europe | 98.3 /100 | #91 | Exceptional $110,614 |