Immigrants from Thailand vs Spanish Median Family Income
COMPARE
Immigrants from Thailand
Spanish
Median Family Income
Median Family Income Comparison
Immigrants from Thailand
Spanish
$99,840
MEDIAN FAMILY INCOME
19.0/ 100
METRIC RATING
201st/ 347
METRIC RANK
$99,977
MEDIAN FAMILY INCOME
20.1/ 100
METRIC RATING
200th/ 347
METRIC RANK
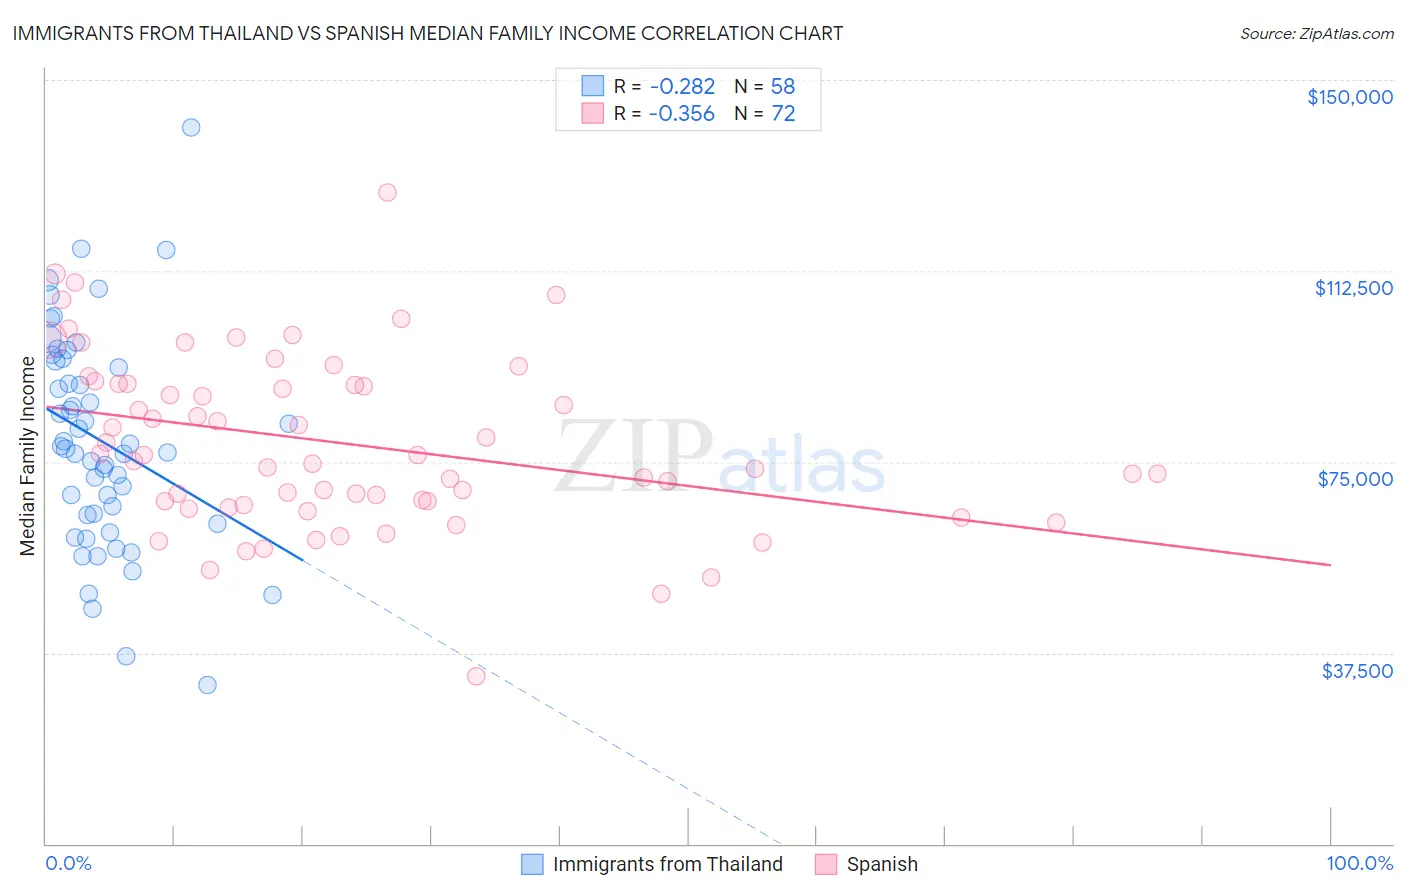
Immigrants from Thailand vs Spanish Median Family Income Correlation Chart
The statistical analysis conducted on geographies consisting of 316,887,320 people shows a weak negative correlation between the proportion of Immigrants from Thailand and median family income in the United States with a correlation coefficient (R) of -0.282 and weighted average of $99,840. Similarly, the statistical analysis conducted on geographies consisting of 421,758,667 people shows a mild negative correlation between the proportion of Spanish and median family income in the United States with a correlation coefficient (R) of -0.356 and weighted average of $99,977, a difference of 0.14%.
Median Family Income Correlation Summary
| Measurement | Immigrants from Thailand | Spanish |
| Minimum | $31,250 | $32,992 |
| Maximum | $140,711 | $127,945 |
| Range | $109,461 | $94,953 |
| Mean | $79,142 | $78,597 |
| Median | $77,801 | $75,704 |
| Interquartile 25% (IQ1) | $64,533 | $66,829 |
| Interquartile 75% (IQ3) | $94,707 | $90,296 |
| Interquartile Range (IQR) | $30,174 | $23,466 |
| Standard Deviation (Sample) | $21,144 | $17,174 |
| Standard Deviation (Population) | $20,961 | $17,054 |
Demographics Similar to Immigrants from Thailand and Spanish by Median Family Income
In terms of median family income, the demographic groups most similar to Immigrants from Thailand are White/Caucasian ($99,800, a difference of 0.040%), Scotch-Irish ($99,591, a difference of 0.25%), Yugoslavian ($100,119, a difference of 0.28%), Immigrants from Africa ($100,256, a difference of 0.42%), and Immigrants from Cameroon ($100,289, a difference of 0.45%). Similarly, the demographic groups most similar to Spanish are Yugoslavian ($100,119, a difference of 0.14%), White/Caucasian ($99,800, a difference of 0.18%), Immigrants from Africa ($100,256, a difference of 0.28%), Immigrants from Cameroon ($100,289, a difference of 0.31%), and Samoan ($100,344, a difference of 0.37%).
| Demographics | Rating | Rank | Median Family Income |
| Immigrants | Immigrants | 29.4 /100 | #190 | Fair $100,962 |
| Colombians | 27.2 /100 | #191 | Fair $100,750 |
| Immigrants | Kenya | 26.5 /100 | #192 | Fair $100,679 |
| Iraqis | 26.3 /100 | #193 | Fair $100,658 |
| Uruguayans | 26.3 /100 | #194 | Fair $100,656 |
| Immigrants | South America | 23.9 /100 | #195 | Fair $100,414 |
| Samoans | 23.3 /100 | #196 | Fair $100,344 |
| Immigrants | Cameroon | 22.8 /100 | #197 | Fair $100,289 |
| Immigrants | Africa | 22.5 /100 | #198 | Fair $100,256 |
| Yugoslavians | 21.3 /100 | #199 | Fair $100,119 |
| Spanish | 20.1 /100 | #200 | Fair $99,977 |
| Immigrants | Thailand | 19.0 /100 | #201 | Poor $99,840 |
| Whites/Caucasians | 18.7 /100 | #202 | Poor $99,800 |
| Scotch-Irish | 17.1 /100 | #203 | Poor $99,591 |
| Ghanaians | 12.6 /100 | #204 | Poor $98,877 |
| Hawaiians | 12.5 /100 | #205 | Poor $98,869 |
| Immigrants | Iraq | 12.1 /100 | #206 | Poor $98,786 |
| Aleuts | 11.6 /100 | #207 | Poor $98,702 |
| Immigrants | Uruguay | 9.2 /100 | #208 | Tragic $98,205 |
| Immigrants | Colombia | 8.7 /100 | #209 | Tragic $98,067 |
| Puget Sound Salish | 8.2 /100 | #210 | Tragic $97,958 |