Belizean vs Immigrants from Sweden Median Family Income
COMPARE
Belizean
Immigrants from Sweden
Median Family Income
Median Family Income Comparison
Belizeans
Immigrants from Sweden
$90,880
MEDIAN FAMILY INCOME
0.2/ 100
METRIC RATING
269th/ 347
METRIC RANK
$122,765
MEDIAN FAMILY INCOME
100.0/ 100
METRIC RATING
22nd/ 347
METRIC RANK
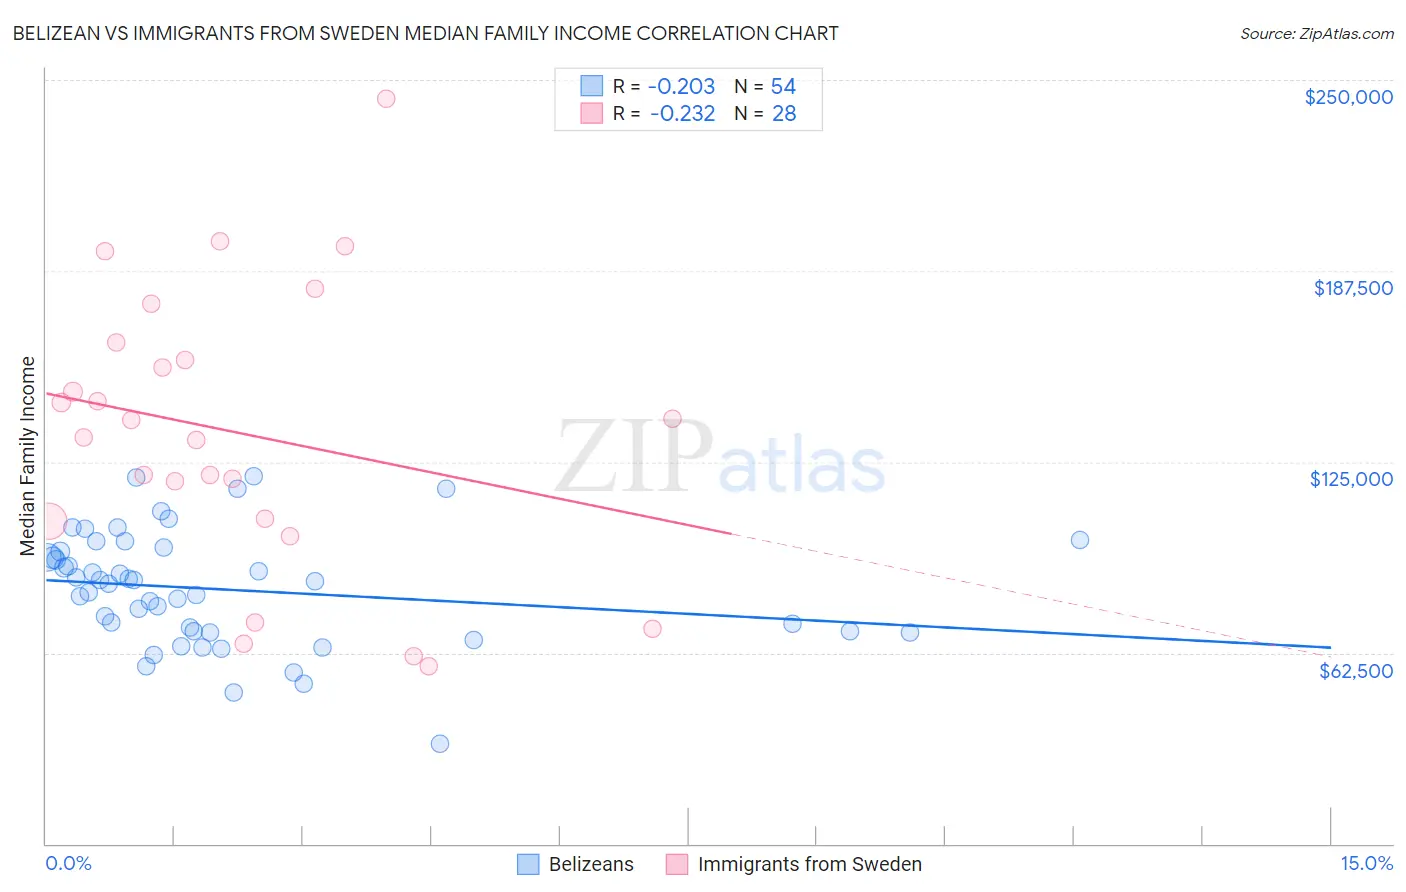
Belizean vs Immigrants from Sweden Median Family Income Correlation Chart
The statistical analysis conducted on geographies consisting of 144,140,604 people shows a weak negative correlation between the proportion of Belizeans and median family income in the United States with a correlation coefficient (R) of -0.203 and weighted average of $90,880. Similarly, the statistical analysis conducted on geographies consisting of 164,691,599 people shows a weak negative correlation between the proportion of Immigrants from Sweden and median family income in the United States with a correlation coefficient (R) of -0.232 and weighted average of $122,765, a difference of 35.1%.
Median Family Income Correlation Summary
| Measurement | Belizean | Immigrants from Sweden |
| Minimum | $32,813 | $57,930 |
| Maximum | $120,348 | $244,028 |
| Range | $87,535 | $186,098 |
| Mean | $83,217 | $134,549 |
| Median | $85,583 | $135,850 |
| Interquartile 25% (IQ1) | $69,412 | $105,866 |
| Interquartile 75% (IQ3) | $95,563 | $161,266 |
| Interquartile Range (IQR) | $26,151 | $55,400 |
| Standard Deviation (Sample) | $18,683 | $46,012 |
| Standard Deviation (Population) | $18,509 | $45,183 |
Similar Demographics by Median Family Income
Demographics Similar to Belizeans by Median Family Income
In terms of median family income, the demographic groups most similar to Belizeans are Cree ($90,882, a difference of 0.0%), Mexican American Indian ($90,918, a difference of 0.040%), Central American ($91,087, a difference of 0.23%), Jamaican ($90,581, a difference of 0.33%), and Iroquois ($90,543, a difference of 0.37%).
| Demographics | Rating | Rank | Median Family Income |
| Liberians | 0.4 /100 | #262 | Tragic $91,722 |
| Immigrants | West Indies | 0.3 /100 | #263 | Tragic $91,588 |
| Senegalese | 0.3 /100 | #264 | Tragic $91,475 |
| Hmong | 0.3 /100 | #265 | Tragic $91,296 |
| Central Americans | 0.3 /100 | #266 | Tragic $91,087 |
| Mexican American Indians | 0.2 /100 | #267 | Tragic $90,918 |
| Cree | 0.2 /100 | #268 | Tragic $90,882 |
| Belizeans | 0.2 /100 | #269 | Tragic $90,880 |
| Jamaicans | 0.2 /100 | #270 | Tragic $90,581 |
| Iroquois | 0.2 /100 | #271 | Tragic $90,543 |
| Immigrants | Liberia | 0.2 /100 | #272 | Tragic $90,450 |
| Immigrants | Micronesia | 0.2 /100 | #273 | Tragic $90,345 |
| Spanish Americans | 0.2 /100 | #274 | Tragic $90,322 |
| Immigrants | St. Vincent and the Grenadines | 0.2 /100 | #275 | Tragic $90,094 |
| Immigrants | Zaire | 0.1 /100 | #276 | Tragic $89,285 |
Demographics Similar to Immigrants from Sweden by Median Family Income
In terms of median family income, the demographic groups most similar to Immigrants from Sweden are Immigrants from Japan ($122,764, a difference of 0.0%), Immigrants from Korea ($122,800, a difference of 0.030%), Burmese ($123,369, a difference of 0.49%), Immigrants from Northern Europe ($121,840, a difference of 0.76%), and Immigrants from Belgium ($123,831, a difference of 0.87%).
| Demographics | Rating | Rank | Median Family Income |
| Eastern Europeans | 100.0 /100 | #15 | Exceptional $125,546 |
| Immigrants | China | 100.0 /100 | #16 | Exceptional $125,540 |
| Indians (Asian) | 100.0 /100 | #17 | Exceptional $125,312 |
| Immigrants | Eastern Asia | 100.0 /100 | #18 | Exceptional $125,150 |
| Immigrants | Belgium | 100.0 /100 | #19 | Exceptional $123,831 |
| Burmese | 100.0 /100 | #20 | Exceptional $123,369 |
| Immigrants | Korea | 100.0 /100 | #21 | Exceptional $122,800 |
| Immigrants | Sweden | 100.0 /100 | #22 | Exceptional $122,765 |
| Immigrants | Japan | 100.0 /100 | #23 | Exceptional $122,764 |
| Immigrants | Northern Europe | 100.0 /100 | #24 | Exceptional $121,840 |
| Turks | 100.0 /100 | #25 | Exceptional $121,202 |
| Immigrants | Switzerland | 100.0 /100 | #26 | Exceptional $120,726 |
| Russians | 100.0 /100 | #27 | Exceptional $120,487 |
| Immigrants | Denmark | 100.0 /100 | #28 | Exceptional $120,445 |
| Latvians | 100.0 /100 | #29 | Exceptional $120,301 |