Immigrants from Turkey vs Immigrants from Belarus Median Earnings
COMPARE
Immigrants from Turkey
Immigrants from Belarus
Median Earnings
Median Earnings Comparison
Immigrants from Turkey
Immigrants from Belarus
$52,960
MEDIAN EARNINGS
100.0/ 100
METRIC RATING
39th/ 347
METRIC RANK
$53,043
MEDIAN EARNINGS
100.0/ 100
METRIC RATING
37th/ 347
METRIC RANK
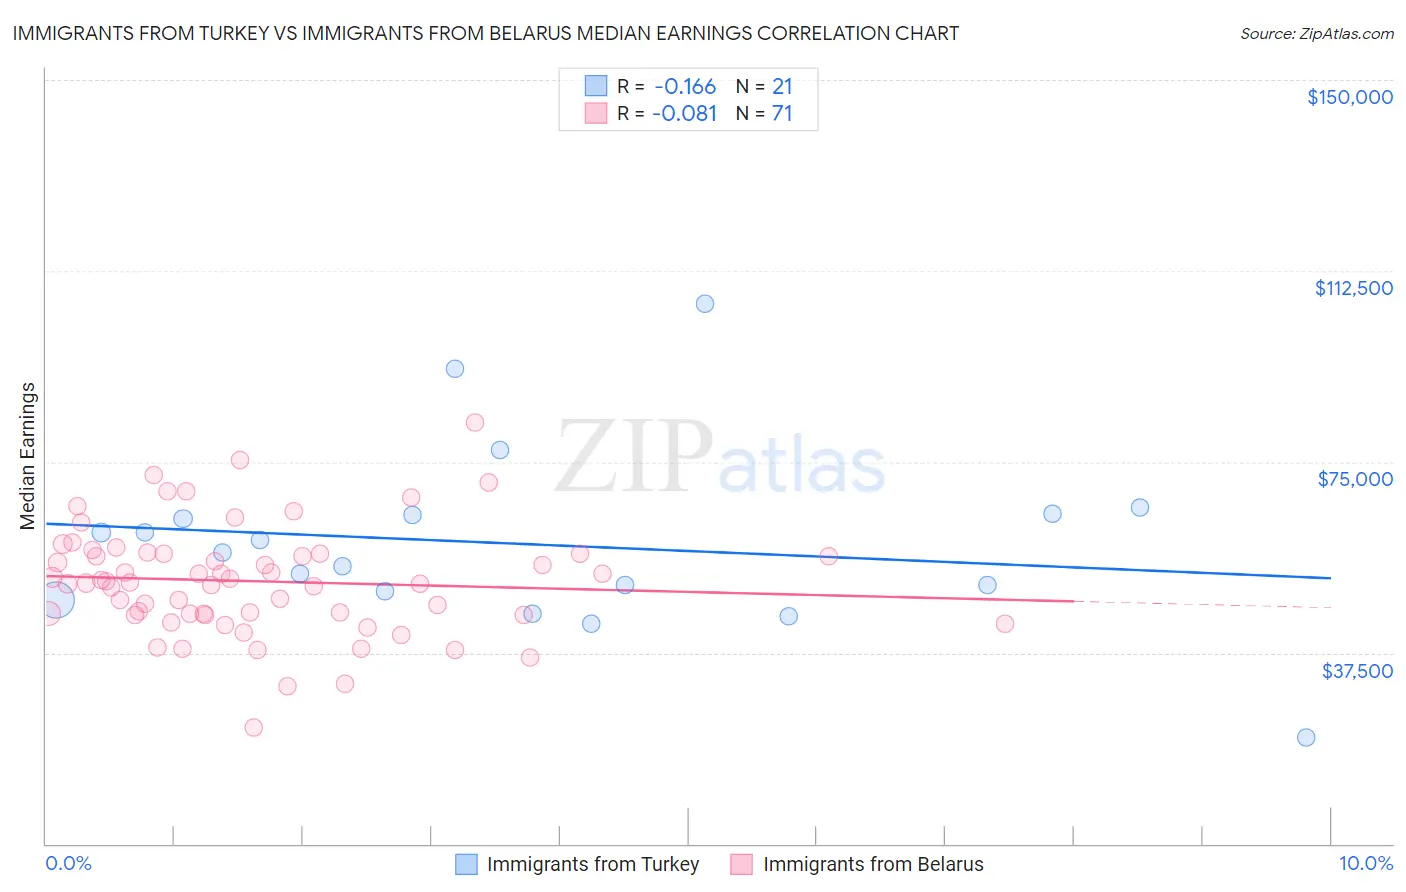
Immigrants from Turkey vs Immigrants from Belarus Median Earnings Correlation Chart
The statistical analysis conducted on geographies consisting of 223,042,474 people shows a poor negative correlation between the proportion of Immigrants from Turkey and median earnings in the United States with a correlation coefficient (R) of -0.166 and weighted average of $52,960. Similarly, the statistical analysis conducted on geographies consisting of 150,193,045 people shows a slight negative correlation between the proportion of Immigrants from Belarus and median earnings in the United States with a correlation coefficient (R) of -0.081 and weighted average of $53,043, a difference of 0.16%.
Median Earnings Correlation Summary
| Measurement | Immigrants from Turkey | Immigrants from Belarus |
| Minimum | $20,750 | $22,866 |
| Maximum | $106,061 | $82,699 |
| Range | $85,311 | $59,833 |
| Mean | $58,831 | $51,554 |
| Median | $57,227 | $51,310 |
| Interquartile 25% (IQ1) | $48,717 | $45,000 |
| Interquartile 75% (IQ3) | $64,687 | $56,946 |
| Interquartile Range (IQR) | $15,970 | $11,946 |
| Standard Deviation (Sample) | $17,879 | $10,748 |
| Standard Deviation (Population) | $17,448 | $10,672 |
Demographics Similar to Immigrants from Turkey and Immigrants from Belarus by Median Earnings
In terms of median earnings, the demographic groups most similar to Immigrants from Turkey are Israeli ($52,937, a difference of 0.040%), Latvian ($53,001, a difference of 0.080%), Immigrants from Lithuania ($52,769, a difference of 0.36%), Immigrants from Denmark ($53,186, a difference of 0.43%), and Immigrants from Switzerland ($53,211, a difference of 0.47%). Similarly, the demographic groups most similar to Immigrants from Belarus are Latvian ($53,001, a difference of 0.080%), Israeli ($52,937, a difference of 0.20%), Immigrants from Denmark ($53,186, a difference of 0.27%), Immigrants from Switzerland ($53,211, a difference of 0.32%), and Immigrants from Sri Lanka ($53,268, a difference of 0.42%).
| Demographics | Rating | Rank | Median Earnings |
| Immigrants | France | 100.0 /100 | #28 | Exceptional $53,490 |
| Immigrants | Russia | 100.0 /100 | #29 | Exceptional $53,457 |
| Cambodians | 100.0 /100 | #30 | Exceptional $53,386 |
| Russians | 100.0 /100 | #31 | Exceptional $53,334 |
| Immigrants | Asia | 100.0 /100 | #32 | Exceptional $53,310 |
| Immigrants | Greece | 100.0 /100 | #33 | Exceptional $53,282 |
| Immigrants | Sri Lanka | 100.0 /100 | #34 | Exceptional $53,268 |
| Immigrants | Switzerland | 100.0 /100 | #35 | Exceptional $53,211 |
| Immigrants | Denmark | 100.0 /100 | #36 | Exceptional $53,186 |
| Immigrants | Belarus | 100.0 /100 | #37 | Exceptional $53,043 |
| Latvians | 100.0 /100 | #38 | Exceptional $53,001 |
| Immigrants | Turkey | 100.0 /100 | #39 | Exceptional $52,960 |
| Israelis | 100.0 /100 | #40 | Exceptional $52,937 |
| Immigrants | Lithuania | 100.0 /100 | #41 | Exceptional $52,769 |
| Maltese | 100.0 /100 | #42 | Exceptional $52,526 |
| Immigrants | Malaysia | 100.0 /100 | #43 | Exceptional $52,514 |
| Bulgarians | 100.0 /100 | #44 | Exceptional $52,512 |
| Immigrants | Czechoslovakia | 100.0 /100 | #45 | Exceptional $52,361 |
| Bhutanese | 100.0 /100 | #46 | Exceptional $52,297 |
| Australians | 100.0 /100 | #47 | Exceptional $52,294 |
| Immigrants | Europe | 100.0 /100 | #48 | Exceptional $52,195 |