Immigrants from Albania vs Immigrants from Guatemala Median Male Earnings
COMPARE
Immigrants from Albania
Immigrants from Guatemala
Median Male Earnings
Median Male Earnings Comparison
Immigrants from Albania
Immigrants from Guatemala
$57,179
MEDIAN MALE EARNINGS
93.3/ 100
METRIC RATING
121st/ 347
METRIC RANK
$46,244
MEDIAN MALE EARNINGS
0.0/ 100
METRIC RATING
315th/ 347
METRIC RANK
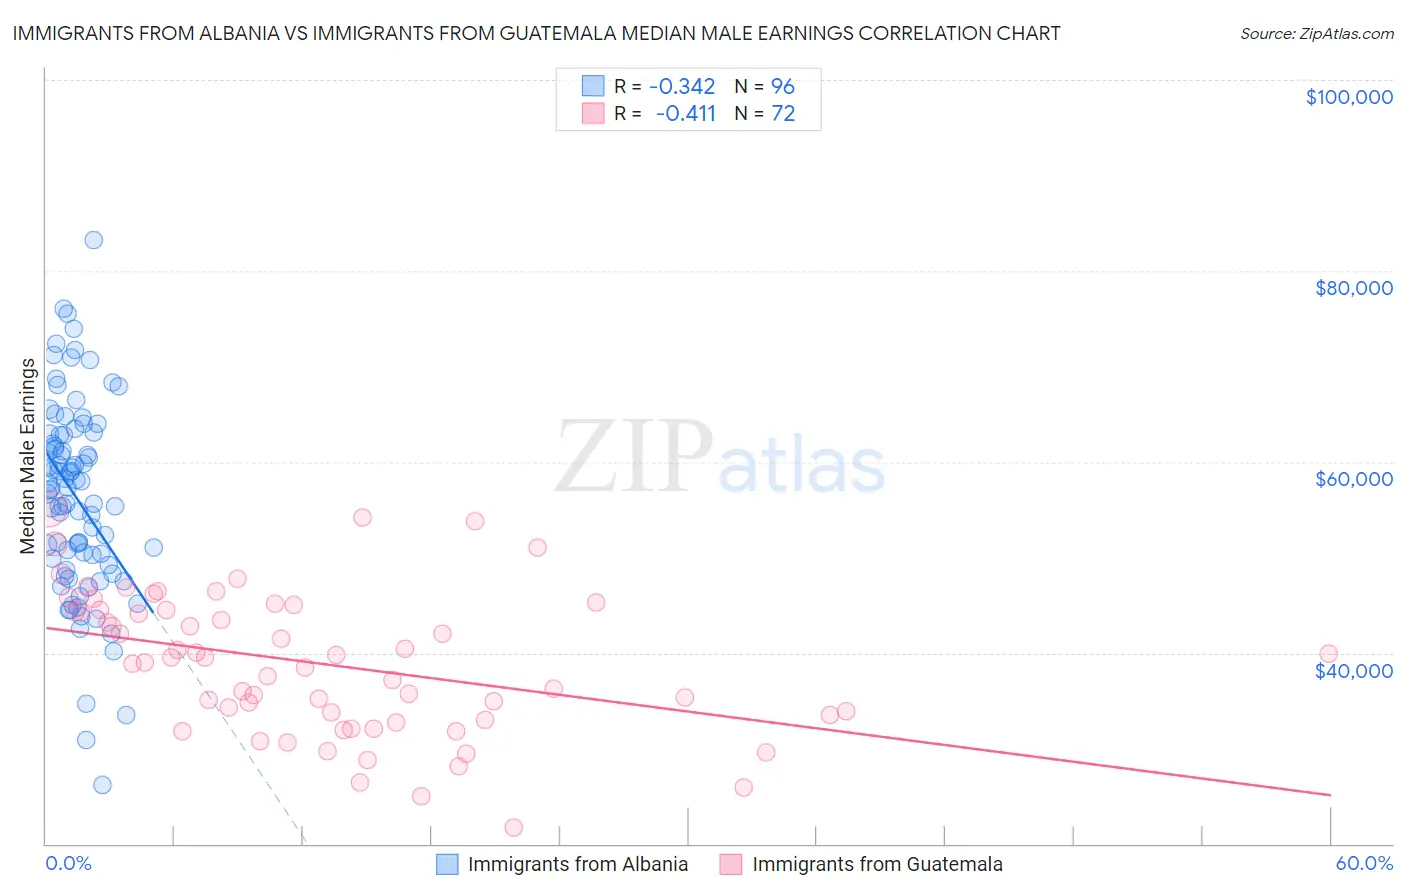
Immigrants from Albania vs Immigrants from Guatemala Median Male Earnings Correlation Chart
The statistical analysis conducted on geographies consisting of 119,358,930 people shows a mild negative correlation between the proportion of Immigrants from Albania and median male earnings in the United States with a correlation coefficient (R) of -0.342 and weighted average of $57,179. Similarly, the statistical analysis conducted on geographies consisting of 377,185,627 people shows a moderate negative correlation between the proportion of Immigrants from Guatemala and median male earnings in the United States with a correlation coefficient (R) of -0.411 and weighted average of $46,244, a difference of 23.6%.
Median Male Earnings Correlation Summary
| Measurement | Immigrants from Albania | Immigrants from Guatemala |
| Minimum | $26,127 | $21,641 |
| Maximum | $83,209 | $55,102 |
| Range | $57,082 | $33,461 |
| Mean | $56,160 | $38,841 |
| Median | $57,139 | $39,223 |
| Interquartile 25% (IQ1) | $49,475 | $33,223 |
| Interquartile 75% (IQ3) | $62,806 | $44,533 |
| Interquartile Range (IQR) | $13,331 | $11,310 |
| Standard Deviation (Sample) | $10,176 | $7,423 |
| Standard Deviation (Population) | $10,123 | $7,371 |
Similar Demographics by Median Male Earnings
Demographics Similar to Immigrants from Albania by Median Male Earnings
In terms of median male earnings, the demographic groups most similar to Immigrants from Albania are Immigrants from Jordan ($57,145, a difference of 0.060%), Slovene ($57,145, a difference of 0.060%), Canadian ($57,286, a difference of 0.19%), Arab ($57,298, a difference of 0.21%), and Hungarian ($57,309, a difference of 0.23%).
| Demographics | Rating | Rank | Median Male Earnings |
| Immigrants | Kuwait | 95.3 /100 | #114 | Exceptional $57,562 |
| Swedes | 94.8 /100 | #115 | Exceptional $57,445 |
| Lebanese | 94.6 /100 | #116 | Exceptional $57,409 |
| Immigrants | Zimbabwe | 94.3 /100 | #117 | Exceptional $57,352 |
| Hungarians | 94.0 /100 | #118 | Exceptional $57,309 |
| Arabs | 94.0 /100 | #119 | Exceptional $57,298 |
| Canadians | 93.9 /100 | #120 | Exceptional $57,286 |
| Immigrants | Albania | 93.3 /100 | #121 | Exceptional $57,179 |
| Immigrants | Jordan | 93.1 /100 | #122 | Exceptional $57,145 |
| Slovenes | 93.1 /100 | #123 | Exceptional $57,145 |
| Chileans | 91.9 /100 | #124 | Exceptional $56,973 |
| Immigrants | Morocco | 91.8 /100 | #125 | Exceptional $56,958 |
| Chinese | 91.1 /100 | #126 | Exceptional $56,872 |
| Brazilians | 90.9 /100 | #127 | Exceptional $56,837 |
| Immigrants | Syria | 90.8 /100 | #128 | Exceptional $56,830 |
Demographics Similar to Immigrants from Guatemala by Median Male Earnings
In terms of median male earnings, the demographic groups most similar to Immigrants from Guatemala are Immigrants from Caribbean ($46,193, a difference of 0.11%), Mexican ($46,147, a difference of 0.21%), Chippewa ($46,368, a difference of 0.27%), Honduran ($46,374, a difference of 0.28%), and Hispanic or Latino ($46,419, a difference of 0.38%).
| Demographics | Rating | Rank | Median Male Earnings |
| Ottawa | 0.0 /100 | #308 | Tragic $46,611 |
| Creek | 0.0 /100 | #309 | Tragic $46,594 |
| Cubans | 0.0 /100 | #310 | Tragic $46,580 |
| Apache | 0.0 /100 | #311 | Tragic $46,429 |
| Hispanics or Latinos | 0.0 /100 | #312 | Tragic $46,419 |
| Hondurans | 0.0 /100 | #313 | Tragic $46,374 |
| Chippewa | 0.0 /100 | #314 | Tragic $46,368 |
| Immigrants | Guatemala | 0.0 /100 | #315 | Tragic $46,244 |
| Immigrants | Caribbean | 0.0 /100 | #316 | Tragic $46,193 |
| Mexicans | 0.0 /100 | #317 | Tragic $46,147 |
| Cheyenne | 0.0 /100 | #318 | Tragic $46,062 |
| Haitians | 0.0 /100 | #319 | Tragic $45,903 |
| Immigrants | Honduras | 0.0 /100 | #320 | Tragic $45,787 |
| Fijians | 0.0 /100 | #321 | Tragic $45,607 |
| Sioux | 0.0 /100 | #322 | Tragic $45,566 |