Luxembourger vs Immigrants from Guatemala Median Male Earnings
COMPARE
Luxembourger
Immigrants from Guatemala
Median Male Earnings
Median Male Earnings Comparison
Luxembourgers
Immigrants from Guatemala
$56,300
MEDIAN MALE EARNINGS
85.5/ 100
METRIC RATING
140th/ 347
METRIC RANK
$46,244
MEDIAN MALE EARNINGS
0.0/ 100
METRIC RATING
315th/ 347
METRIC RANK
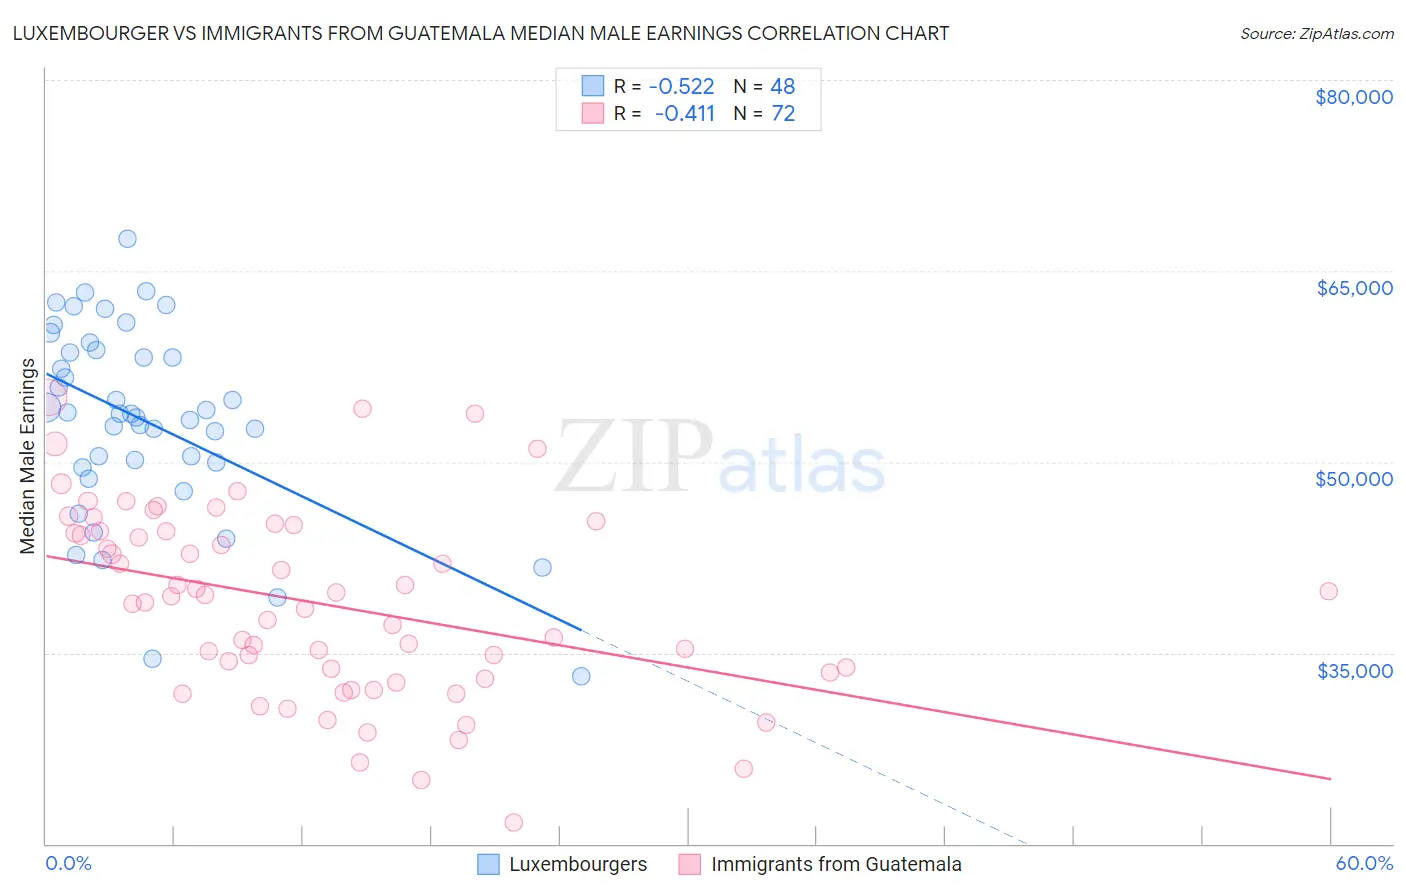
Luxembourger vs Immigrants from Guatemala Median Male Earnings Correlation Chart
The statistical analysis conducted on geographies consisting of 144,673,100 people shows a substantial negative correlation between the proportion of Luxembourgers and median male earnings in the United States with a correlation coefficient (R) of -0.522 and weighted average of $56,300. Similarly, the statistical analysis conducted on geographies consisting of 377,185,627 people shows a moderate negative correlation between the proportion of Immigrants from Guatemala and median male earnings in the United States with a correlation coefficient (R) of -0.411 and weighted average of $46,244, a difference of 21.7%.
Median Male Earnings Correlation Summary
| Measurement | Luxembourger | Immigrants from Guatemala |
| Minimum | $33,125 | $21,641 |
| Maximum | $67,500 | $55,102 |
| Range | $34,375 | $33,461 |
| Mean | $53,182 | $38,841 |
| Median | $53,767 | $39,223 |
| Interquartile 25% (IQ1) | $49,758 | $33,223 |
| Interquartile 75% (IQ3) | $58,691 | $44,533 |
| Interquartile Range (IQR) | $8,933 | $11,310 |
| Standard Deviation (Sample) | $7,604 | $7,423 |
| Standard Deviation (Population) | $7,525 | $7,371 |
Similar Demographics by Median Male Earnings
Demographics Similar to Luxembourgers by Median Male Earnings
In terms of median male earnings, the demographic groups most similar to Luxembourgers are Zimbabwean ($56,302, a difference of 0.0%), Slovak ($56,306, a difference of 0.010%), Danish ($56,246, a difference of 0.10%), Ethiopian ($56,243, a difference of 0.10%), and Slavic ($56,390, a difference of 0.16%).
| Demographics | Rating | Rank | Median Male Earnings |
| Immigrants | Germany | 88.2 /100 | #133 | Excellent $56,542 |
| Moroccans | 87.7 /100 | #134 | Excellent $56,499 |
| Irish | 87.4 /100 | #135 | Excellent $56,464 |
| Immigrants | Saudi Arabia | 87.2 /100 | #136 | Excellent $56,452 |
| Slavs | 86.5 /100 | #137 | Excellent $56,390 |
| Slovaks | 85.5 /100 | #138 | Excellent $56,306 |
| Zimbabweans | 85.5 /100 | #139 | Excellent $56,302 |
| Luxembourgers | 85.5 /100 | #140 | Excellent $56,300 |
| Danes | 84.8 /100 | #141 | Excellent $56,246 |
| Ethiopians | 84.8 /100 | #142 | Excellent $56,243 |
| Sri Lankans | 83.4 /100 | #143 | Excellent $56,136 |
| Immigrants | Uganda | 82.4 /100 | #144 | Excellent $56,064 |
| Norwegians | 80.9 /100 | #145 | Excellent $55,965 |
| Immigrants | Chile | 80.7 /100 | #146 | Excellent $55,954 |
| Immigrants | Philippines | 78.4 /100 | #147 | Good $55,809 |
Demographics Similar to Immigrants from Guatemala by Median Male Earnings
In terms of median male earnings, the demographic groups most similar to Immigrants from Guatemala are Immigrants from Caribbean ($46,193, a difference of 0.11%), Mexican ($46,147, a difference of 0.21%), Chippewa ($46,368, a difference of 0.27%), Honduran ($46,374, a difference of 0.28%), and Hispanic or Latino ($46,419, a difference of 0.38%).
| Demographics | Rating | Rank | Median Male Earnings |
| Ottawa | 0.0 /100 | #308 | Tragic $46,611 |
| Creek | 0.0 /100 | #309 | Tragic $46,594 |
| Cubans | 0.0 /100 | #310 | Tragic $46,580 |
| Apache | 0.0 /100 | #311 | Tragic $46,429 |
| Hispanics or Latinos | 0.0 /100 | #312 | Tragic $46,419 |
| Hondurans | 0.0 /100 | #313 | Tragic $46,374 |
| Chippewa | 0.0 /100 | #314 | Tragic $46,368 |
| Immigrants | Guatemala | 0.0 /100 | #315 | Tragic $46,244 |
| Immigrants | Caribbean | 0.0 /100 | #316 | Tragic $46,193 |
| Mexicans | 0.0 /100 | #317 | Tragic $46,147 |
| Cheyenne | 0.0 /100 | #318 | Tragic $46,062 |
| Haitians | 0.0 /100 | #319 | Tragic $45,903 |
| Immigrants | Honduras | 0.0 /100 | #320 | Tragic $45,787 |
| Fijians | 0.0 /100 | #321 | Tragic $45,607 |
| Sioux | 0.0 /100 | #322 | Tragic $45,566 |