Arab vs Immigrants from Albania Householder Income Under 25 years
COMPARE
Arab
Immigrants from Albania
Householder Income Under 25 years
Householder Income Under 25 years Comparison
Arabs
Immigrants from Albania
$51,219
HOUSEHOLDER INCOME UNDER 25 YEARS
8.5/ 100
METRIC RATING
219th/ 347
METRIC RANK
$53,597
HOUSEHOLDER INCOME UNDER 25 YEARS
96.9/ 100
METRIC RATING
115th/ 347
METRIC RANK
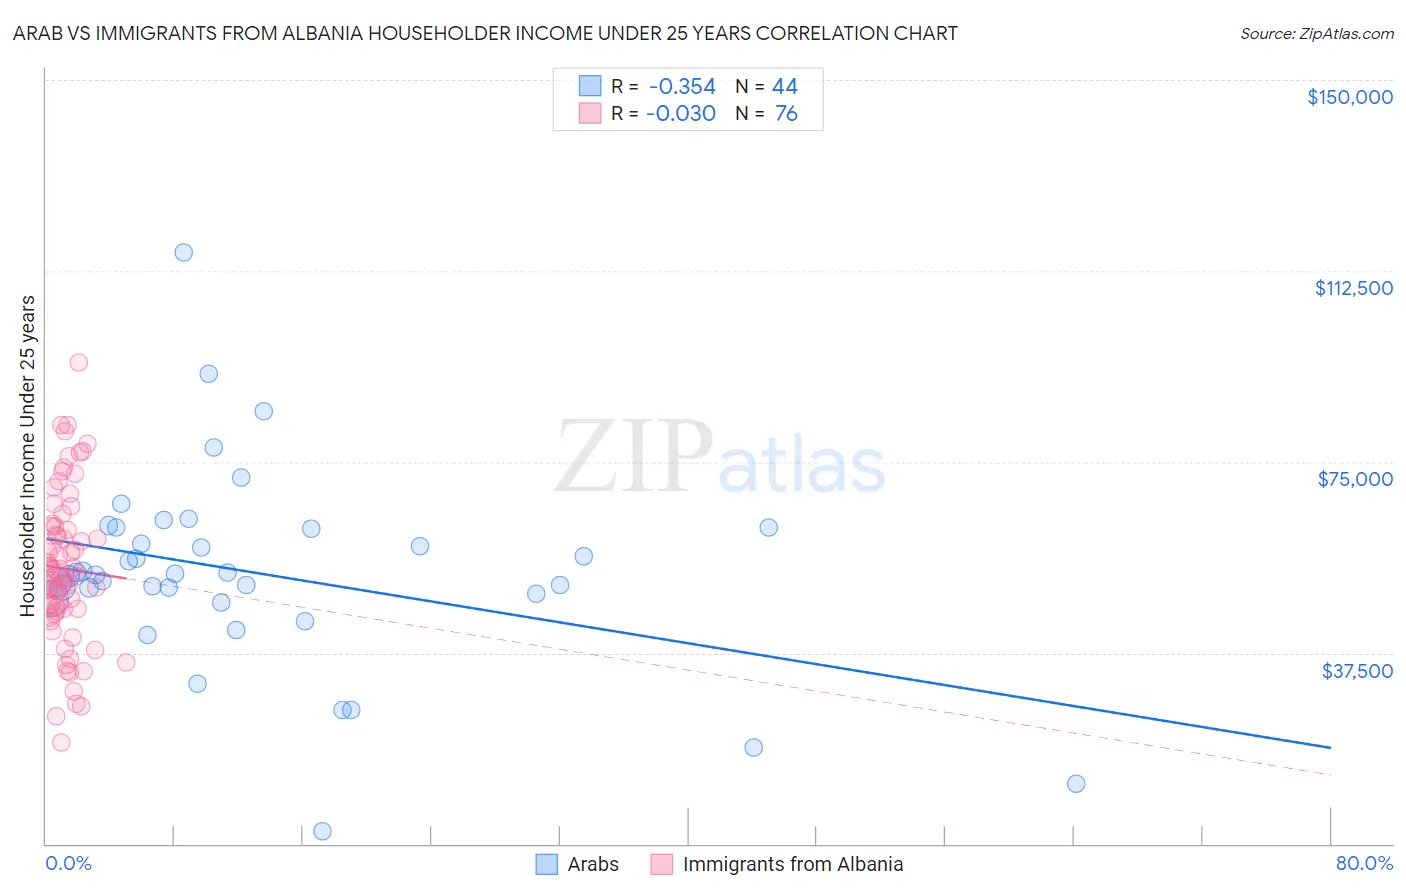
Arab vs Immigrants from Albania Householder Income Under 25 years Correlation Chart
The statistical analysis conducted on geographies consisting of 397,690,882 people shows a mild negative correlation between the proportion of Arabs and household income with householder under the age of 25 in the United States with a correlation coefficient (R) of -0.354 and weighted average of $51,219. Similarly, the statistical analysis conducted on geographies consisting of 107,044,611 people shows no correlation between the proportion of Immigrants from Albania and household income with householder under the age of 25 in the United States with a correlation coefficient (R) of -0.030 and weighted average of $53,597, a difference of 4.6%.
Householder Income Under 25 years Correlation Summary
| Measurement | Arab | Immigrants from Albania |
| Minimum | $2,499 | $19,811 |
| Maximum | $116,189 | $94,545 |
| Range | $113,690 | $74,734 |
| Mean | $53,228 | $54,041 |
| Median | $52,860 | $53,274 |
| Interquartile 25% (IQ1) | $48,642 | $45,869 |
| Interquartile 75% (IQ3) | $61,942 | $62,406 |
| Interquartile Range (IQR) | $13,300 | $16,537 |
| Standard Deviation (Sample) | $19,395 | $14,993 |
| Standard Deviation (Population) | $19,173 | $14,894 |
Similar Demographics by Householder Income Under 25 years
Demographics Similar to Arabs by Householder Income Under 25 years
In terms of householder income under 25 years, the demographic groups most similar to Arabs are Czechoslovakian ($51,224, a difference of 0.010%), Immigrants from Belize ($51,223, a difference of 0.010%), French ($51,230, a difference of 0.020%), Icelander ($51,247, a difference of 0.050%), and Immigrants from Germany ($51,190, a difference of 0.060%).
| Demographics | Rating | Rank | Householder Income Under 25 years |
| Immigrants | Panama | 9.7 /100 | #212 | Tragic $51,278 |
| Dutch | 9.4 /100 | #213 | Tragic $51,265 |
| Zimbabweans | 9.3 /100 | #214 | Tragic $51,259 |
| Icelanders | 9.1 /100 | #215 | Tragic $51,247 |
| French | 8.7 /100 | #216 | Tragic $51,230 |
| Czechoslovakians | 8.6 /100 | #217 | Tragic $51,224 |
| Immigrants | Belize | 8.6 /100 | #218 | Tragic $51,223 |
| Arabs | 8.5 /100 | #219 | Tragic $51,219 |
| Immigrants | Germany | 8.0 /100 | #220 | Tragic $51,190 |
| Immigrants | Eastern Africa | 7.4 /100 | #221 | Tragic $51,158 |
| Spaniards | 6.8 /100 | #222 | Tragic $51,117 |
| Serbians | 6.6 /100 | #223 | Tragic $51,106 |
| Belizeans | 6.4 /100 | #224 | Tragic $51,094 |
| Immigrants | Jamaica | 5.6 /100 | #225 | Tragic $51,038 |
| Yugoslavians | 5.5 /100 | #226 | Tragic $51,028 |
Demographics Similar to Immigrants from Albania by Householder Income Under 25 years
In terms of householder income under 25 years, the demographic groups most similar to Immigrants from Albania are Immigrants from Sweden ($53,621, a difference of 0.040%), Romanian ($53,632, a difference of 0.070%), Immigrants from Spain ($53,560, a difference of 0.070%), Lithuanian ($53,552, a difference of 0.080%), and Immigrants from Switzerland ($53,528, a difference of 0.13%).
| Demographics | Rating | Rank | Householder Income Under 25 years |
| Maltese | 97.8 /100 | #108 | Exceptional $53,735 |
| Immigrants | Ecuador | 97.7 /100 | #109 | Exceptional $53,722 |
| Greeks | 97.7 /100 | #110 | Exceptional $53,715 |
| Immigrants | Colombia | 97.7 /100 | #111 | Exceptional $53,714 |
| Immigrants | Oceania | 97.5 /100 | #112 | Exceptional $53,680 |
| Romanians | 97.2 /100 | #113 | Exceptional $53,632 |
| Immigrants | Sweden | 97.1 /100 | #114 | Exceptional $53,621 |
| Immigrants | Albania | 96.9 /100 | #115 | Exceptional $53,597 |
| Immigrants | Spain | 96.6 /100 | #116 | Exceptional $53,560 |
| Lithuanians | 96.6 /100 | #117 | Exceptional $53,552 |
| Immigrants | Switzerland | 96.3 /100 | #118 | Exceptional $53,528 |
| Italians | 95.4 /100 | #119 | Exceptional $53,426 |
| Guamanians/Chamorros | 95.3 /100 | #120 | Exceptional $53,423 |
| Immigrants | Canada | 95.2 /100 | #121 | Exceptional $53,411 |
| Immigrants | Ethiopia | 95.2 /100 | #122 | Exceptional $53,408 |