Slovene vs Immigrants from Mexico Householder Income Under 25 years
COMPARE
Slovene
Immigrants from Mexico
Householder Income Under 25 years
Householder Income Under 25 years Comparison
Slovenes
Immigrants from Mexico
$50,886
HOUSEHOLDER INCOME UNDER 25 YEARS
4.0/ 100
METRIC RATING
232nd/ 347
METRIC RANK
$50,422
HOUSEHOLDER INCOME UNDER 25 YEARS
1.3/ 100
METRIC RATING
252nd/ 347
METRIC RANK
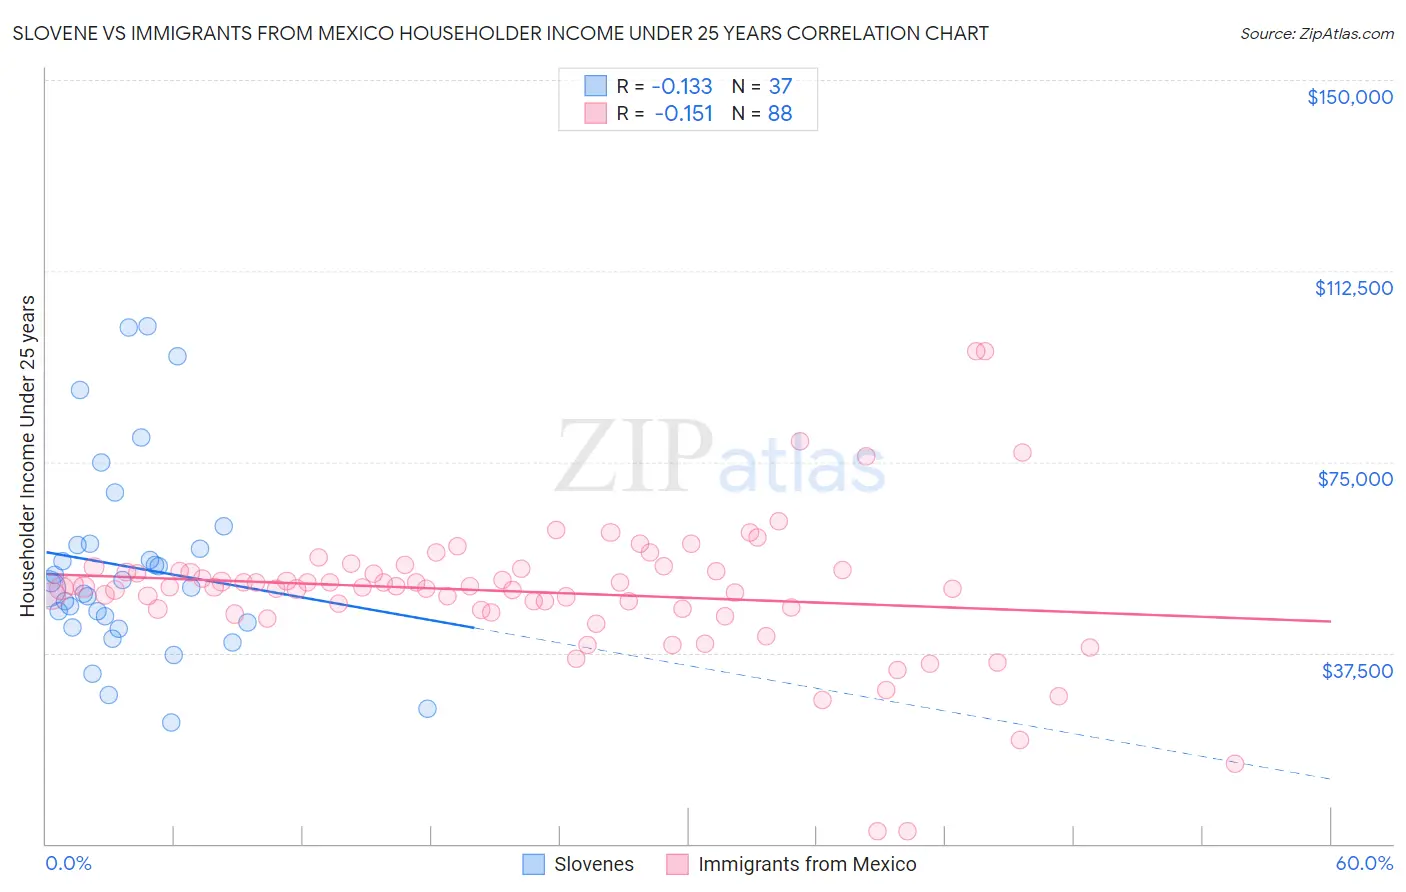
Slovene vs Immigrants from Mexico Householder Income Under 25 years Correlation Chart
The statistical analysis conducted on geographies consisting of 227,902,139 people shows a poor negative correlation between the proportion of Slovenes and household income with householder under the age of 25 in the United States with a correlation coefficient (R) of -0.133 and weighted average of $50,886. Similarly, the statistical analysis conducted on geographies consisting of 414,348,765 people shows a poor negative correlation between the proportion of Immigrants from Mexico and household income with householder under the age of 25 in the United States with a correlation coefficient (R) of -0.151 and weighted average of $50,422, a difference of 0.92%.
Householder Income Under 25 years Correlation Summary
| Measurement | Slovene | Immigrants from Mexico |
| Minimum | $23,750 | $2,499 |
| Maximum | $101,719 | $96,667 |
| Range | $77,969 | $94,168 |
| Mean | $54,363 | $49,454 |
| Median | $50,342 | $50,399 |
| Interquartile 25% (IQ1) | $42,924 | $45,992 |
| Interquartile 75% (IQ3) | $58,799 | $53,646 |
| Interquartile Range (IQR) | $15,875 | $7,654 |
| Standard Deviation (Sample) | $19,097 | $14,134 |
| Standard Deviation (Population) | $18,837 | $14,054 |
Demographics Similar to Slovenes and Immigrants from Mexico by Householder Income Under 25 years
In terms of householder income under 25 years, the demographic groups most similar to Slovenes are Pennsylvania German ($50,852, a difference of 0.070%), Kenyan ($50,815, a difference of 0.14%), Spanish ($50,813, a difference of 0.14%), English ($50,805, a difference of 0.16%), and German ($50,804, a difference of 0.16%). Similarly, the demographic groups most similar to Immigrants from Mexico are Celtic ($50,447, a difference of 0.050%), Immigrants from Cabo Verde ($50,520, a difference of 0.19%), Scottish ($50,554, a difference of 0.26%), Immigrants from Bosnia and Herzegovina ($50,565, a difference of 0.28%), and Slavic ($50,563, a difference of 0.28%).
| Demographics | Rating | Rank | Householder Income Under 25 years |
| Slovenes | 4.0 /100 | #232 | Tragic $50,886 |
| Pennsylvania Germans | 3.7 /100 | #233 | Tragic $50,852 |
| Kenyans | 3.3 /100 | #234 | Tragic $50,815 |
| Spanish | 3.3 /100 | #235 | Tragic $50,813 |
| English | 3.3 /100 | #236 | Tragic $50,805 |
| Germans | 3.3 /100 | #237 | Tragic $50,804 |
| Iraqis | 3.2 /100 | #238 | Tragic $50,802 |
| Immigrants | Caribbean | 2.9 /100 | #239 | Tragic $50,757 |
| Immigrants | Lebanon | 2.7 /100 | #240 | Tragic $50,729 |
| Immigrants | Micronesia | 2.5 /100 | #241 | Tragic $50,691 |
| Cubans | 2.3 /100 | #242 | Tragic $50,655 |
| Immigrants | Thailand | 2.2 /100 | #243 | Tragic $50,645 |
| Marshallese | 2.1 /100 | #244 | Tragic $50,627 |
| Immigrants | Africa | 2.0 /100 | #245 | Tragic $50,609 |
| Welsh | 2.0 /100 | #246 | Tragic $50,597 |
| Immigrants | Bosnia and Herzegovina | 1.8 /100 | #247 | Tragic $50,565 |
| Slavs | 1.8 /100 | #248 | Tragic $50,563 |
| Scottish | 1.8 /100 | #249 | Tragic $50,554 |
| Immigrants | Cabo Verde | 1.7 /100 | #250 | Tragic $50,520 |
| Celtics | 1.4 /100 | #251 | Tragic $50,447 |
| Immigrants | Mexico | 1.3 /100 | #252 | Tragic $50,422 |